-
Economic
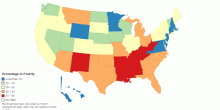
Percentage in poverty (2009)
This map shows Percentage in poverty (2009) rank.3.95 rating | 9,850 views | Discuss this15 years ago -
Economic
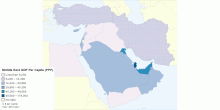
Middle East GDP Per Capita (PPP)
This map shows Middle East GDP on a purchasing power parity basis divided by population as of 1 July for the year 2010.3.00 rating | 9,500 views | Discuss this15 years ago -
Economic
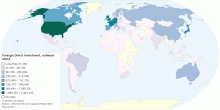
Foreign Direct Investment, outward stock
This interactive map shows the value of outward stock of foreign direct investment at the country-level, in million US dollars. Global foreign direct investment ...5.00 rating | 9,335 views | Discuss this14 years ago -
Economic
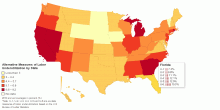
Alternative Measures of Labor Underutilization for ...
This map shows six alternative measures of labor underutilization for United States by state. United States, 2010 annual averages (percent): U-1: 5.7% U-2: ...3.67 rating | 6,803 views | Discuss this15 years ago -
Economic
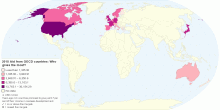
2010 Aid from OECD countries: Who gives the most?
This map shows 2010 Official Development Assistance by OECD member countries. 41 years ago (in 1969) rich countries promised to give 0.7 per cent of their income ...2.60 rating | 6,002 views | Discuss this15 years ago -
Economic
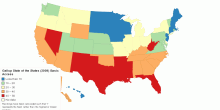
Gallup State of the States (2009) Basic Access
This map shows Gallup State of the States (2009) Basic Access rank.1.00 rating | 5,761 views | Discuss this15 years ago -
Economic
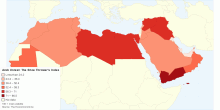
Arab Unrest: The Shoe Thrower's Index
This map shows the Shoe Thrower's Index. The Shoe Thrower's Index is an index of unrest in the Arab world published by the Economist Newspaper Limited. ...4.33 rating | 5,723 views | Discuss this15 years ago -
Economic
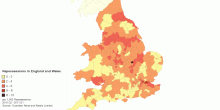
Repossessions in England and Wales (2010 Q2 - 2011 Q1)
This map shows repossessions across England and Wales during the first quarter of 2011 Repossessions across England and Wales have risen - there is a 4% increas ...5.00 rating | 3,778 views | Discuss this14 years ago
