-
Energy
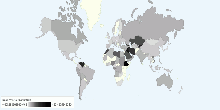
Current Worldwide Reserves-to-production ratio of Oil
This chart shows the Current World Reserves-to-production ratio of Oil. Current World Reserves-to-production ratio of Oil: 42.11 Years What Does Reserves to Pr ...4.12 rating | 26,646 views | 1 Comment17 years ago -
Energy
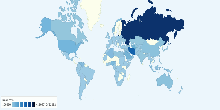
Current Worldwide Natural Gas reserves
This chart shows current Natural Gas reserves in the world. Current Natural Gas reserves in the World: 184,573,964,748,442 cubic meters (cu m or m³)4.11 rating | 22,498 views | 20 Comments17 years ago -
Energy
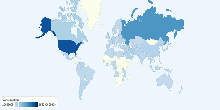
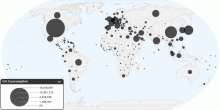
Current Worldwide Natural Gas Consumption
This chart shows current Natural Gas Consumption in the world. Current Natural Gas Consumption in the World: 3,015,443,467,227 cubic meters (m³)4.03 rating | 13,971 views | 4 Comments17 years ago -
Energy
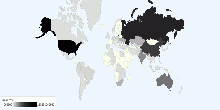
Current Worldwide Coal reserves
This chart shows current Coal Proved Reserves in the world. Current Coal Proved Reserves in the World: 820,001,000,000 tonnes4.06 rating | 20,485 views | Discuss this17 years ago -
Energy
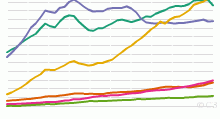
Historical Oil Consumption by Region, 1965 to Present
This chart shows the historical Oil Consumption in barrels per day - 1965 onwards. List of countries included in each region: North America includes United ...4.07 rating | 47,007 views | 2 Comments17 years ago -
Energy
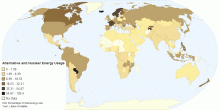
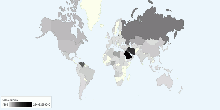
Alternative and Nuclear Energy (Percentage of Total ...
This map shows clean energy, expressed as a percentage of total energy use. Clean energy is noncarbohydrate energy that does not produce carbon dioxide whe ...4.02 rating | 46,061 views | 7 Comments15 years ago -
Energy
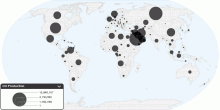
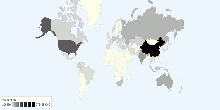
Current Worldwide Oil Production
This chart shows current oil production in the world. Current Oil Production in the World: 81,820,404.59 barrels per day (bbl/day) 1 barrel = (42 US gallons, 158 ...4.04 rating | 65,931 views | 13 Comments16 years ago -
Energy
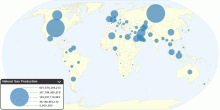
Current Worldwide Natural Gas Production
This chart shows current Natural Gas Production in the world. Current Natural Gas Production in the World: 3,065,690,558,538 cubic meters (cu m)3.86 rating | 20,199 views | Discuss this17 years ago -
Energy
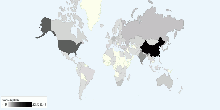
Current Worldwide Oil Consumption
This chart shows current oil consumption in the world. Current Oil Consumption in the World: 84,455,330 barrels per day (bbl/day) 1 barrel = (42 US gallons, 158. ...3.96 rating | 47,713 views | 42 Comments16 years ago -
Energy
Current Worldwide Oil reserves
This chart shows current Oil reserves in the world. Current Oil reserves in the World: 1,248,795,488,139 barrels (bbl) (42 US gallons, 158.9873 litres,or 34.9723 ...3.80 rating | 27,953 views | 10 Comments17 years ago -
Energy
Current Worldwide Coal Production
This chart shows current Coal Production in the world. Current Coal Production in the World: 6,781,173,808 tonnes3.74 rating | 14,677 views | Discuss this17 years ago -
Energy
Current Worldwide Coal Consumption
This chart shows current Coal Consumption in the world. Current Coal Consumption in the World: 6,647,551,377.2 Metric Tons3.61 rating | 21,791 views | 1 Comment17 years ago -
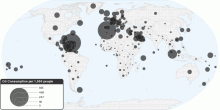
Energy
Current Worldwide Oil Consumption per 1000 people
This chart shows current oil consumption (per capita) in the world. Current Oil Consumption in the World: 31.1 barrels per day (bbl/day) per 1,000 people 1 b ...3.48 rating | 29,461 views | Discuss this16 years ago