-
Work
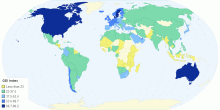
Global Entrepreneurship Index 2016
This chart shows Global Entrepreneurship Index 2016. Entrepreneurship is the process of designing, launching, and running a new business,a startup company offer ...3.67 rating | 10,004 views | Discuss this10 years ago -
Infrastructure
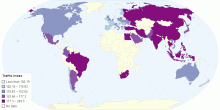
Traffic Index for Country 2016
This charts shows Traffic Index for Country 2016. Traffic on roads may consist of pedestrians, ridden or herded animals, vehicles, streetcars, buses and other c ...4.00 rating | 8,494 views | Discuss this10 years ago -
Environment
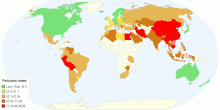
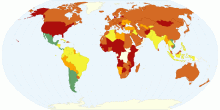
Pollution Index 2016
This chart shows Pollution Index for Country 2016. Pollution is the introduction of contaminants into the natural environment that cause adverse change.Pollutio ...4.15 rating | 63,527 views | Discuss this10 years ago -
Society
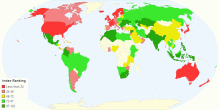
Cost of Living Index 2016
This chrt shows Cost Of Living Index 2016. Cost of living is the cost of maintaining a certain standard of living. Changes in the cost of living over time are ...3.55 rating | 16,095 views | Discuss this10 years ago -
Social
Crime Index for Country 2016
This chart shows the Crime Index for Country 2016. Crime denotes an unlawful act punishable by a state.The most popular view is that crime is a category create ...4.24 rating | 128,291 views | Discuss this10 years ago -
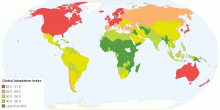
Environment
Global Adaptation Index
This chart shows the Notre Dame Global Adaptation Index by Country. The ND-GAIN Index is a navigation tool that helps corporate and development leaders manage r ...3.18 rating | 10,775 views | Discuss this10 years ago -
Others
Good Country Index
This chart shows the Good Country Index by Country. The Good Country Index measures how much each of the 125 countries on the list contribute to the planet and ...3.00 rating | 9,347 views | Discuss this10 years ago -
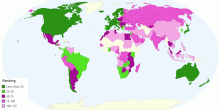
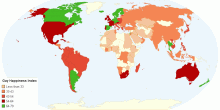
Country Info
Gay Happiness Index and Rank
This chart shows the Gay Happiness Index and Rank by country. Happiness is a mental or emotional state of well-being defined by positive or pleasant emotions ra ...2.60 rating | 34,842 views | Discuss this10 years ago -
Environment
Happy Planet Index (HPI)
This map shows the overall scores from the second global compilation of the Happy Planet Index (HPI). The HPI is an index of human well-being and environmental i ...3.77 rating | 8,962 views | Discuss this11 years ago -
Society
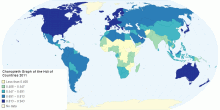
Choropleth Graph of the Hdi of Countries 2011
A choropleth graph of the HDI (Human Development Index) in the world in 20115.00 rating | 3,518 views | Discuss this11 years ago -
Education
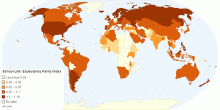
Gender Parity Index for School Life Expectancy
This chart shows gender parity index details for school life expectancy. School Life Expectancy is a measure of how many years of education a child of sch ...1.00 rating | 6,615 views | 1 Comment11 years ago -
Country Info
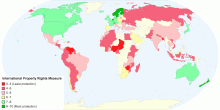
International Property Rights Measure
This is a measure of property rights, by country, with higher numbers indicating better protections of property rights.5.00 rating | 52,761 views | Discuss this11 years ago -
Economic
Fragile States Index
This map shows 2014 Fragile States Index details. The Fragile States Index (FSI), produced by The Fund for Peace, is a critical tool in highlighting not only th ...4.57 rating | 11,647 views | Discuss this11 years ago -
Country Info
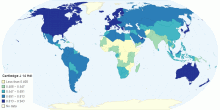
Cartledge J 14 HDI
The Human Development Index for all the countries in the world0.00 rating | 3,367 views | Discuss this12 years ago -
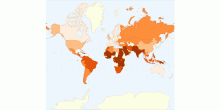
People
Gender Inequality in the World
Gender Inequality Index projected on the world3.99 rating | 120,567 views | 2 Comments13 years ago