-
Food & Agriculture
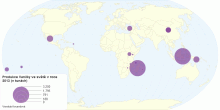
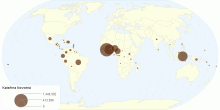
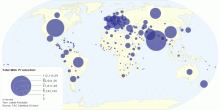
Production of vanilla in the world in 2013
Největší produkce vanilky je v Indonésii a na Madagascaru. Významnými producenty jsou také Mexiko, Čí ...5.00 rating | 2,418 views | Discuss this9 years ago -
Country Info
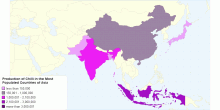
Production of Chilli in the Most Populated Countrie ...
Production of chilli in the most populated countries of asia0.00 rating | 1,594 views | Discuss this6 years ago -
Energy
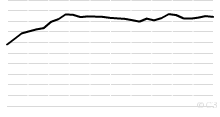
Historical World Reserves-to-production ratio of Oi ...
This chart shows the Historical World Reserves-to-production ratio of Oil - 1980 onwards. Current World Reserves-to-production ratio of Oil: 42.11 Years What D ...4.17 rating | 22,470 views | Discuss this16 years ago -
Drugs & Crime
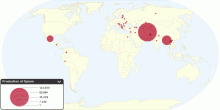
Current Worldwide Illicit Cultivation of Opium Popp ...
This chart shows current worldwide illicit cultivation of opium poppy and production of opium. Total area under opium poppy cultivation in the major culti ...4.19 rating | 183,196 views | Discuss this15 years ago -
Food & Agriculture
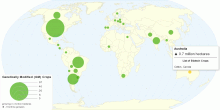
Global Distribution of Genetically Modified (GM) Crops
This map shows global distribution of Genetically Modified (GM) crops. Current World hectarage of biotech crops: 148.6 million hectares in 2010 World hectara ...4.37 rating | 75,561 views | 2 Comments14 years ago -
Food & Agriculture
World wheat production and trade
World wheat production and exports 2010/11, and average import dependence 2006/07-2010/11. Note: France=EU27 / data for EU represents EU27 total, not data for in ...3.86 rating | 5,367 views | Discuss this14 years ago -
Food & Agriculture
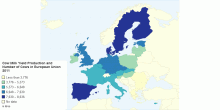
Cow Milk Yield Production and Number of Cows in Eur ...
Simple chart of milk yield, production and number of cows in countries of European union in 2011. Datasource FAOSTAT created by M. Bro0.00 rating | 3,020 views | Discuss this11 years ago -
Food & Agriculture
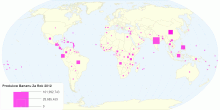
Produkce Bananu Za Rok 2012
Mapa kde nejvíc milují banány :)0.00 rating | 2,434 views | Discuss this11 years ago -
Food & Agriculture
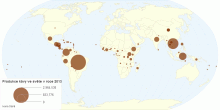
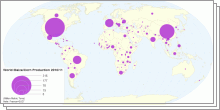
Produkce kakaových bobů ve světě v roce 2013
Největším producentem kakaových bobů ve světě v roce 2013 bylo Pobřeží slonoviny. Na druhém místě se zhruba ve ...5.00 rating | 2,752 views | Discuss this10 years ago -
Others
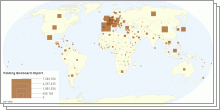
Folding Boxboard Import,Export & Production by country
This chart shows folding boxboard import,export & production by country. Folding boxboard, also referred to as FBB or by the DIN Standard 19303 codes of GC ...5.00 rating | 4,335 views | Discuss this10 years ago -
Food & Agriculture
Produkce kávy ve světě v roce 2013
Největším producentem kávy v roce 2013 byla Brazílie.0.00 rating | 2,603 views | Discuss this9 years ago -
Drugs & Crime
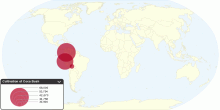
Current Worldwide Illicit Cultivation of Coca Bush ...
This chart shows current worldwide illicit cultivation of coca bush and production of cocaine. Total area under coca bush cultivation: 158,800 hectares (h ...3.22 rating | 21,366 views | Discuss this15 years ago -
Energy
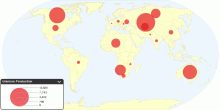
Current Worldwide Uranium Production
This map shows current worldwide uranium production from mines. A prominent use of uranium from mining is as fuel for nuclear power plants. The worldwide product ...4.32 rating | 26,035 views | 1 Comment15 years ago -
Food & Agriculture
Current Worldwide Total Milk Production
This map shows current worldwide total Milk production. World Total Milk Production: 703,996,079 tonnes per year Note: Total Milk = Cow milk + Buffalo milk + G ...4.40 rating | 119,882 views | 4 Comments14 years ago -
Food & Agriculture
World maize/corn production and trade
World maize/corn production and exports 2010/11, and average import dependence 2006/07-2010/11. Note: France=EU27 / data for EU represents EU27 total, not data f ...4.71 rating | 6,332 views | Discuss this14 years ago