-
Society
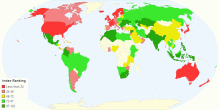
Cost of Living Index 2016
This chrt shows Cost Of Living Index 2016. Cost of living is the cost of maintaining a certain standard of living. Changes in the cost of living over time are ...3.67 rating | 14,247 views | Discuss this9 years ago -
Social
Crime Index for Country 2016
This chart shows the Crime Index for Country 2016. Crime denotes an unlawful act punishable by a state.The most popular view is that crime is a category create ...4.24 rating | 125,640 views | Discuss this9 years ago -
Food & Agriculture
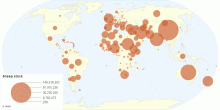
Pigs Stock by Country
This chart shows the Pig Stock by Country. A pig is any of the animals in the genus Sus, within the Suidae family of even-toed ungulates. Pigs include the domes ...3.67 rating | 4,937 views | Discuss this9 years ago -
Education
Transparency International School on Integrity 2015
This chart shows Transparency International School on Integrity 2015 by Country. Transparency International School on Integrity (TISI) is an annual state-of-the ...5.00 rating | 5,793 views | Discuss this9 years ago -
Others
Sheep Livestock Data by Country
This chart shows Sheep Livestock Data by Country. The sheep (Ovis aries) is a quadrupedal, ruminant mammal typically kept as livestock. Like all ruminants, shee ...3.62 rating | 17,522 views | Discuss this9 years ago -
Food & Agriculture
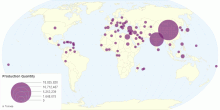
Eggplants Production Quantity by Country
This chart shows the Eggplant Production Quantity by Country. Eggplant or aubergine is a species of nightshade grown for its edible fruit."Eggplant&qu ...4.08 rating | 5,949 views | Discuss this9 years ago -
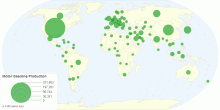
Energy
Motor Gasoline Production by country
This chart shows the Motor Gasoline production by country. Gasoline also known as petrol outside of North America, is a transparent, petroleum-derived liquid th ...5.00 rating | 4,634 views | Discuss this9 years ago -
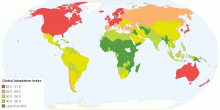
Environment
Global Adaptation Index
This chart shows the Notre Dame Global Adaptation Index by Country. The ND-GAIN Index is a navigation tool that helps corporate and development leaders manage r ...3.18 rating | 8,929 views | Discuss this9 years ago -
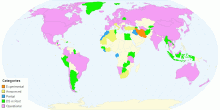
Country Info
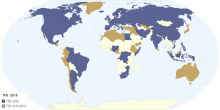
DNSSEC Deployment Status on 25-01-2016.
This chart shows the DNSSEC Deployment Status on 25-01-2016. The maps provide a view into global DNSSEC deployment and break the deployment status of top-level ...3.22 rating | 7,788 views | Discuss this9 years ago -
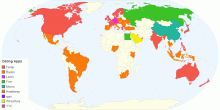
Information and Communication Technology
Most Downloaded Dating Apps by Country
This chart shows the Most Downloaded Dating Apps by Country. Millions of people use dating apps to overcome social barriers, busy schedules and shyness in their ...3.70 rating | 118,845 views | Discuss this9 years ago -
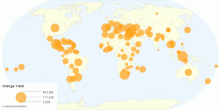
Food & Agriculture
Orange Yield by Country
This map shows the Orange Yield by Country. The orange (the sweet orange) is the fruit of the citrus species Citrus × sinensis in the family Rutaceae.The ...3.67 rating | 3,870 views | Discuss this9 years ago -
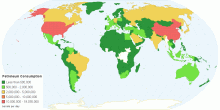
Energy
Petroleum Consumption
This chart shows the Consumption of Petroleum by Country. This shows the country's total consumption of refined petroleum products, in barrels per day (bbl/ ...4.20 rating | 8,188 views | Discuss this9 years ago -
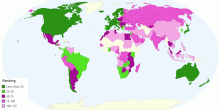
Others
Good Country Index
This chart shows the Good Country Index by Country. The Good Country Index measures how much each of the 125 countries on the list contribute to the planet and ...3.00 rating | 5,644 views | Discuss this9 years ago -
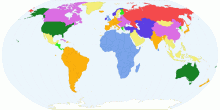
Others
The World According to Donald Trump
This chart shows The World According To Donald Trump. 2016 Republican presidential candidate Donald Trump described immigrants crossing the Mexico-US bord ...3.82 rating | 4,898 views | Discuss this9 years ago -
Information and Communication Technology
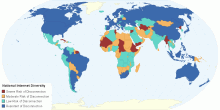
National Internet Diversity at the International Frontier
This chart shows the National Internet Diversity at the International Frontier. The Internet is supposed to be a distributed architecture, designed to withstand ...5.00 rating | 8,464 views | Discuss this9 years ago