-
People
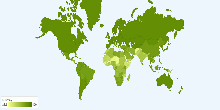
World Literacy by Country
This chart shows current world literacy. Current World Literacy: 82% of total population3.88 rating | 13,317 views | Discuss this17 years ago -
People
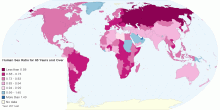
Worldwide Human Sex Ratio for 65 Years and Over
This map shows worldwide human sex ratio for 65 years and over. Sex ratio is the number of males for each female. Current world sex ratio for 65 years and over: ...3.80 rating | 24,014 views | Discuss this15 years ago -
Country Info
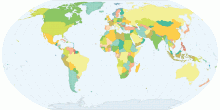
Flags of Every Country
This map shows Flags of every country in the world. Flag description produced from actual flags or the best information available at the time the entry was writ ...4.60 rating | 1,376,996 views | 151 Comments15 years ago -
Food & Agriculture
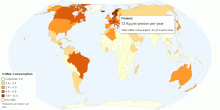
Current Worldwide Annual Coffee Consumption per capita
This map shows Coffee consumption in kilograms, consumed annually by each person in a given country or region. Current World Total Coffee Consumption: 1.3 Kilogr ...4.51 rating | 837,618 views | 26 Comments15 years ago -
Country Info
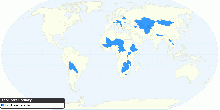
Landlocked country
This map shows worldwide Landlocked country. Number of Landlocked country: 444.56 rating | 91,457 views | 5 Comments17 years ago -
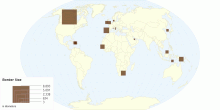
Tourism
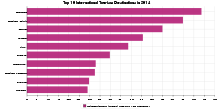
Top 10 Most Visited Countries by Tourists in 2014
Out of a global total of 1.133 billion tourists, the top ten international tourism destinations in 2014 are shown in the above chart. Note: Images are for refer ...4.51 rating | 69,407 views | Discuss this10 years ago -
Drugs & Crime
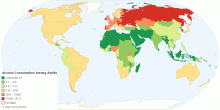
Current Worldwide Alcohol Consumption Among Adults
This chart shows alcohol consumption among adults aged ≥ 15 years in litres per person per year. Current worldwide alcohol consumption among adults: 6.13 lit ...4.47 rating | 238,533 views | 3 Comments15 years ago -
Education
Current Worldwide Public Expenditure on Education a ...
This chart shows public expenditure in a given financial year on education as a percentage of GDP. Public expenditure on education as a percentage of GDP gives ...4.36 rating | 31,434 views | 1 Comment17 years ago -
Country Info
Countries That Border Only One Other Country
This map shows list of sovereign countries that border only one other country, with only land borders being counted.4.29 rating | 65,028 views | 3 Comments15 years ago -
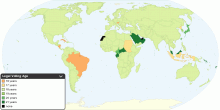
Country Info
Legal Voting Age around the World
This map shows legal voting age around the world. A voting age is a minimum age established by law that a person must attain to be eligible to vote in a public e ...4.27 rating | 190,246 views | 19 Comments17 years ago -
Health
Current World HIV/AIDS Deaths
This chart shows current world HIV/AIDS deaths. Current World HIV/AIDS Deaths: 2 million4.33 rating | 13,655 views | 2 Comments17 years ago -
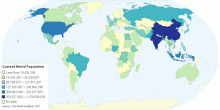
Population
Current World Population
This map shows an estimate from the US Bureau of the Census based on statistics from population censuses, vital statistics registration systems, or sample survey ...4.25 rating | 28,083 views | Discuss this10 years ago -
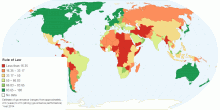
Society
Rule of Law
This map shows "Rule of Law", a dimension of governances in Worldwide Governance Indicators (WGI) project by World Bank Group, which reflects perceptio ...4.27 rating | 16,544 views | Discuss this10 years ago -
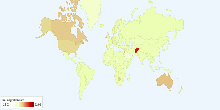
Immigration
Migration Rate by Country
This chart shows migration rate by country (migrant(s)/1,000 population).4.24 rating | 18,572 views | Discuss this17 years ago -
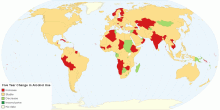
Drugs & Crime
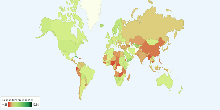
Five Year Change in Alcohol Use
This map shows five-year change (2001 - 2005) in recorded adult (15+) per capita alcohol consumption. The trend shows relatively stable global alcohol consumpti ...4.09 rating | 19,640 views | 1 Comment15 years ago