-
Social
The Best and Worst Countries to Be a Mother
This map shows 2010 Mothers' Index around the world. The Mothers' Index helps document conditions for mothers and children in 160 countries (43 developed nations ...4.00 rating | 49,683 views | 8 Comments16 years ago -
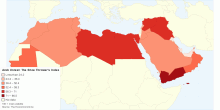
Economic
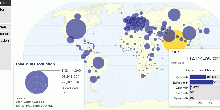
Arab Unrest: The Shoe Thrower's Index
This map shows the Shoe Thrower's Index. The Shoe Thrower's Index is an index of unrest in the Arab world published by the Economist Newspaper Limited. ...4.33 rating | 5,884 views | Discuss this15 years ago -
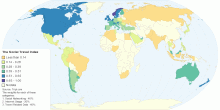
Tourism
The Social Travel Index - A Country Perspective
This map shows the Social Travel Index created by Peter Sullivan Tripl Co-Founder. The Internet has allowed the world to become a much more global environment w ...3.67 rating | 7,363 views | 1 Comment15 years ago -
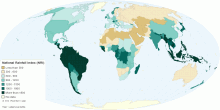
Environment
National Rainfall Index (NRI)
This map shows national rainfall index (NRI). Waht is National Rainfall Index (NRI)? A national rainfall index (NRI) is defined as the national average of the ...4.62 rating | 38,130 views | Discuss this15 years ago -
Drugs & Crime
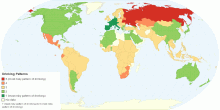
Worldwide Alcohol Drinking Patterns
This map shows worldwide alcohol drinking patterns. Alcohol drinking patterns is based on Patterns of Drinking Score. What is the Patterns of Drinking Score (PD ...4.33 rating | 33,892 views | 1 Comment15 years ago -
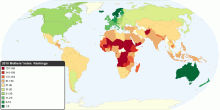
Health
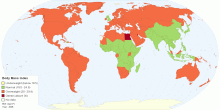
Body Mass Index (BMI) by Country
This map shows World trends in age-standardized mean Body Mass Index (BMI) 199 countries over 28 years. The worldwide prevalence of obesity has nearly doubled s ...4.12 rating | 198,791 views | 11 Comments15 years ago -
Economic
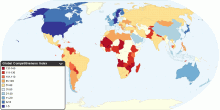
Global Competitiveness Index
This map shows 2010-2011 Global Competitiveness Index (GCI) in 139 major and emerging economies from all of the world's regions. The GCI, a highly comprehensive ...4.49 rating | 38,745 views | 3 Comments16 years ago -
Drugs & Crime
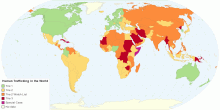
Human Trafficking in the World
This map shows government action to combat human trafficking and modern slavery in 177 countries with Tier 1 ranking as the highest ranking. A Tier 1 indicates t ...4.30 rating | 123,485 views | 6 Comments15 years ago -
Food & Agriculture
Global Nutrition Consumption and BMI
This map shows worldwide nutrition consumption and body mass index data. The dietary energy consumption per person is the amount of food, in kcal per day, for ea ...3.95 rating | 104,855 views | 7 Comments15 years ago -
Economic
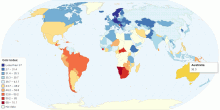
Distribution of Family Income - Gini Index
This map shows the degree of inequality in the distribution of family income (Gini index or Gini coefficient) in each country. Income distribution measure ...4.47 rating | 80,137 views | 6 Comments15 years ago -
Social
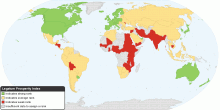
The Legatum Prosperity Index
This map shows the Prosperity Index for 110 countries. 2010 Key Findings: Entrepreneurship and opportunity correlate more closely to a nation's overall pros ...4.33 rating | 32,209 views | 3 Comments15 years ago