-
Social
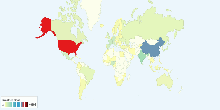
Number of Cinema Screens by Country
This chart shows number of cinema screens in each country. Cinema screens include Indoor screens and Drive-in screens. Number of cinema screens in the maj ...3.68 rating | 78,501 views | 1 Comment15 years ago -
Energy
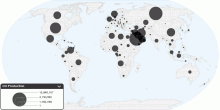
Current Worldwide Oil Production
This chart shows current oil production in the world. Current Oil Production in the World: 81,820,404.59 barrels per day (bbl/day) 1 barrel = (42 US gallons, 158 ...4.04 rating | 64,124 views | 13 Comments15 years ago -
Economic
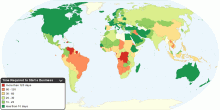
Time Required to Start a Business
This map shows time required to start a business around the world in days. Time required to start a business is the number of calendar days needed to complete th ...4.56 rating | 63,284 views | 14 Comments15 years ago -
Food & Agriculture
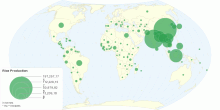
Worldwide Rice Production
This map shows global rice production. Worldwide Rice Production : 678,688,289 tonnes Worldwide Rice Area Harvested : 161,420,743 Ha World production of rice ...4.19 rating | 62,192 views | 6 Comments14 years ago -
Education
Duration of Compulsory Education around the World
This chart shows duration of compulsory education around the world. Compulsory education means number of years that children are legally obliged to attend school ...3.92 rating | 55,025 views | 6 Comments15 years ago -
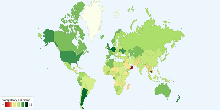
Population
Current World Population Growth Rate
This chart shows current world population growth rate. Current World Population Growth Rate: 1.17%3.42 rating | 47,800 views | 7 Comments16 years ago -
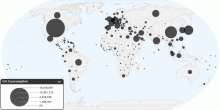
Energy
Current Worldwide Oil Consumption
This chart shows current oil consumption in the world. Current Oil Consumption in the World: 84,455,330 barrels per day (bbl/day) 1 barrel = (42 US gallons, 158. ...3.96 rating | 46,259 views | 42 Comments15 years ago -
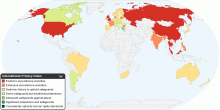
Country Info
International Privacy Index
This map shows the Privacy Index in the world. Since 1997 the UK-based Privacy International in cooperation with the US-based Electronic Privacy Information Cen ...4.23 rating | 45,935 views | Discuss this15 years ago -
Social
Length of Maternity Leave around the World
This chart shows length of maternity leave around the world. Note: see note - Check Dataset for more information.4.23 rating | 38,697 views | 6 Comments15 years ago -
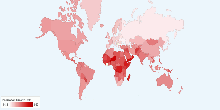
Drugs & Crime
Current Worldwide Annual Prevalence of Cannabis amo ...
This chart shows current worldwide annual prevalence of cannabis in population aged 15-64. Number of people who used cannabis at least once in year: 142.6 - 190. ...4.28 rating | 37,073 views | 8 Comments16 years ago -
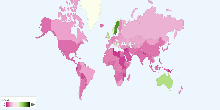
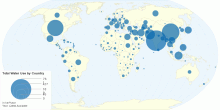
Environment
Total Water Use by Country
This map shows total water withdrawal for agricultural, industrial and municipal purposes by country. Water withdrawal is the quantity of water removed from avai ...3.97 rating | 36,633 views | Discuss this14 years ago -
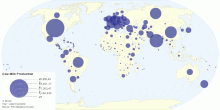
Food & Agriculture
Current Worldwide Cow Milk Production
This map shows current worldwide Cow milk (whole, fresh) production. World Total Cow Milk Production: 585,234,624 tonnes per year4.57 rating | 30,372 views | Discuss this14 years ago -
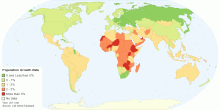
Population
Current World Population Growth Rate
This map shows current world population growth rate. Current World Population Growth Rate: 1.092% (2011 est.) Population growth is the change in a population o ...4.28 rating | 29,372 views | Discuss this14 years ago -
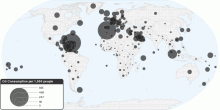
Energy
Current Worldwide Oil Consumption per 1000 people
This chart shows current oil consumption (per capita) in the world. Current Oil Consumption in the World: 31.1 barrels per day (bbl/day) per 1,000 people 1 b ...3.48 rating | 27,747 views | Discuss this15 years ago -
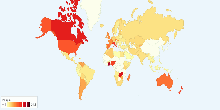
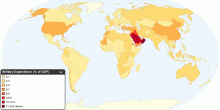
Economic
Current Worldwide Military Expenditure as a percent ...
This map shows public expenditure in a given financial year on military as a percentage of gross domestic product (GDP). Current world military expenditure: roug ...4.32 rating | 27,244 views | 2 Comments15 years ago