-
People
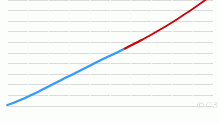
Historical Population of Aboriginal and Torres Stra ...
This chart shows the historical population of Aboriginal and Torres Strait Islander Australians, 1986 onwards. Current population of Aboriginal and Torres Strait ...5.00 rating | 8,302 views | Discuss this16 years ago -
Others
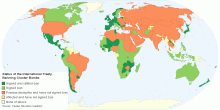
Worldwide Ban on Cluster Bombs
This interactive map shows status of an international treaty (Convention on Cluster Munitions) that prohibits the manufacture, use, transfer and stockpile of clu ...4.76 rating | 12,093 views | Discuss this14 years ago -
Population
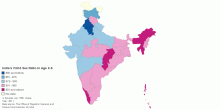
India's Child Sex Ratio in Age Group 0-6
This map shows India's child sex ratio (under 6 years) in 2011 census. India's Child Sex Ratio: 914 females per 1000 males (2011) India's Child Sex ...4.62 rating | 43,283 views | Discuss this14 years ago -
Population
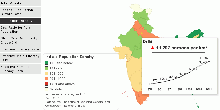
Census of India
This page shows 2011 census of India.4.40 rating | 12,017 views | Discuss this14 years ago -
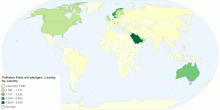
Environment
Pakistan flood aid pledged, country by country
Floods have decimated Pakistan: the number of people suffering could exceed the combined total of the 2004 Indian Ocean tsunami, the 2005 Kashmir earthquake and ...3.00 rating | 9,121 views | Discuss this15 years ago -
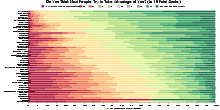
Society
Do You Think Most People Try to Take Advantage of You?
This chart shows the result of (one question in) survey conducted by the World Values Survey (WVS) about Perceptions of Life: Do you think most people would try ...4.28 rating | 109,250 views | 15 Comments14 years ago -
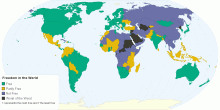
Social
Freedom in the World
This map shows Freedom in the World in 2015. Free: 89 countries Partly Free: 54 countries Not Free: 42 countries Worst of the Worst: 9 countries ...3.95 rating | 174,000 views | Discuss this10 years ago -
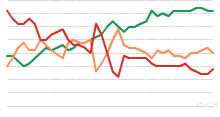
Social
Historical Freedom in the World, 1972 to Present
This chart shows historical Freedom in the World - 1972 onwards. What is Freedom in the World? and How is the Freedom of the World calculated? Note: 1982: T ...3.67 rating | 15,137 views | Discuss this16 years ago -
Social
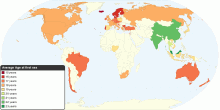
Average Age at first sex by Country
This chart shows average age at first sex by country. Average age at first sex among 44 countries: 18.44.18 rating | 2,278,439 views | 131 Comments16 years ago -
People
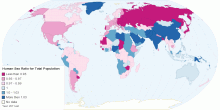
Worldwide Human Sex Ratio for Total Population
This map shows worldwide human sex ratio for the total population. Sex ratio is the number of males for each female. Current world sex ratio for the total popul ...4.13 rating | 891,075 views | Discuss this14 years ago -
People
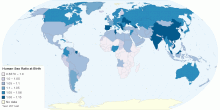
Worldwide Human Sex Ratio at Birth
This map shows worldwide human sex ratio at birth. Sex ratio is the number of males for each female. Current world sex ratio at birth: 1.07:1 male(s)/female (10 ...4.24 rating | 58,037 views | 4 Comments14 years ago -
People
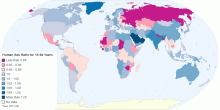
Worldwide Human Sex Ratio for 15-64 Years
This map shows worldwide human sex ratio for 15-64 Years. Sex ratio is the number of males for each female. Current world sex ratio for 15-64 Years: 1.02:1 male ...4.84 rating | 36,684 views | Discuss this14 years ago -
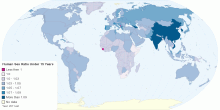
People
Worldwide Human Sex Ratio Under 15 Years
This map shows worldwide human sex ratio under 15 years. Sex ratio is the number of males for each female. Current world sex ratio under 15 years: 1.07:1 male(s ...4.77 rating | 30,509 views | Discuss this14 years ago -
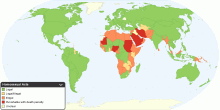
Social
Homosexual Acts around the World
This map shows laws prohibiting same sex activity between consenting adults around the world. Legal - male to male relationships: 118 countries Legal ...4.57 rating | 27,610 views | 3 Comments15 years ago -
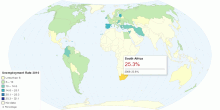
Work
Unemployment Rate by Country
This map shows 2010 global unemployment rate in percentage. With global unemployment, as officially measured, at record highs for the third straight year since ...4.06 rating | 24,088 views | 2 Comments15 years ago