-
Information and Communication Technology
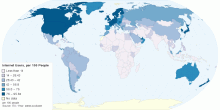
Number of Internet Users by Country, per 100 People
This world map shows Number of Internet Users by Country, per 100 people. Internet users are people with access to the worldwide network. Current worldwide numb ...4.12 rating | 64,570 views | 2 Comments14 years ago -
Economic
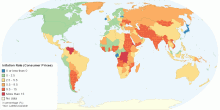
Current Inflation Rate (Consumer Prices) by Country
This map shows current Inflation Rate (consumer prices) by country. It is the annual percent change in consumer prices compared with the previous year's cons ...4.70 rating | 41,102 views | 1 Comment14 years ago -
Food & Agriculture
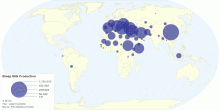
Current Worldwide Sheep Milk Production
This map shows current worldwide Sheep milk (whole, fresh) production. World Total Sheep Milk Production: 9,272,693 tonnes per year4.12 rating | 22,252 views | 2 Comments14 years ago -
Food & Agriculture
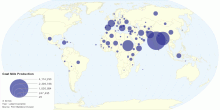
Current Worldwide Goat Milk Production
This map shows current worldwide Goat Milk (whole, fresh) production. World Total Goat Milk Production: 15,510,411 tonnes per year4.63 rating | 27,976 views | Discuss this14 years ago -
Food & Agriculture
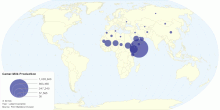
Current Worldwide Camel Milk Production
This map shows current worldwide Camel milk (whole, fresh) production. World Total Camel Milk Production: 1,840,201 tonnes per year4.50 rating | 16,907 views | 1 Comment14 years ago -
Food & Agriculture
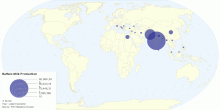
Current Worldwide Buffalo Milk Production
This map shows current worldwide Buffalo Milk (whole, fresh) production. World Total Buffalo Milk production: 92,140,146 tonnes per year4.20 rating | 22,695 views | 1 Comment14 years ago -
Environment
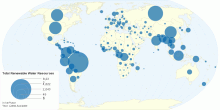
Total Renewable Water Resources per capita by Country
This map shows total renewable water resources per capita by country. Current world total renewable water resources: ~24,776 m³ (cu m)/inhabitant/year ( 24 ...4.37 rating | 95,885 views | Discuss this14 years ago -
Environment
Total Renewable Water Resources by Country
This map shows total renewable water resources by country. It corresponds to the maximum theoretical yearly amount of water actually available for a country at a ...4.29 rating | 34,619 views | 4 Comments14 years ago -
Social
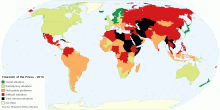
World Press Freedom Index
This chart shows Press Freedom Index, which ranks 178 countries around the world according to press freedom violations. What is Press Freedom Index? The Press ...4.35 rating | 105,139 views | 6 Comments14 years ago -
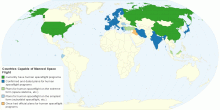
Others
Countries Capable of Manned Space Flight
This map shows countries capable of manned space flight. Manned spaceflight is spaceflight with a human crew and possibly passengers. This makes it unlike robot ...4.39 rating | 17,679 views | 2 Comments14 years ago -
Economic
Global Software Piracy
This maps shows global software piracy. World Software Commercial Value of Unlicensed Software: US $51.4 billion in 2009 ($53 billion in 2008) World Software P ...4.38 rating | 24,628 views | Discuss this14 years ago -
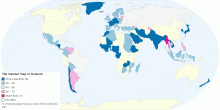
Education
Percentage of Female Researchers within the Total R ...
This map shows percentage of female researchers as a share of the worldwide total researchers. Researchers are defined as professionals engaged in the conception ...4.53 rating | 15,405 views | 1 Comment14 years ago -
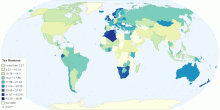
Economic
Total Tax Revenue as a Percentage of Gross Domestic ...
This map shows total tax revenue as a percentage of Gross Domestic Product (GDP). Current world average tax revenue: 15.97% of world GDP Tax revenue refers to ...4.56 rating | 33,393 views | 1 Comment14 years ago -
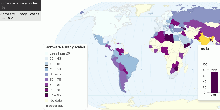
Economic
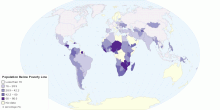
Percentage of Population Living in Poverty
This map shows national estimates of the percentage of the population falling below the poverty line. Definitions of poverty vary considerably among nations. For ...3.71 rating | 57,046 views | 3 Comments14 years ago -
Social
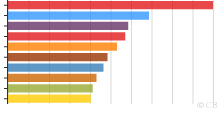
Top 10 Most Pirated Movies of 2010
This graph shows top 10 most pirated movies of 2010. With 16,580,000 downloads on BitTorrent alone, Avatar is undisputedly the most pirated film of the year 201 ...4.26 rating | 24,763 views | 1 Comment14 years ago