-
Economic
Ease of Doing Business - Rank
Thia map shows ease of doing business index, which ranks economies from 1 to 183, with first place being the best. A high ranking means that the regulatory envir ...4.61 rating | 60,983 views | Discuss this15 years ago -
Economic
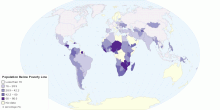
Percentage of Population Living in Poverty
This map shows national estimates of the percentage of the population falling below the poverty line. Definitions of poverty vary considerably among nations. For ...3.71 rating | 59,106 views | 3 Comments15 years ago -
Economic
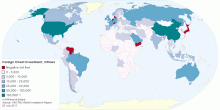
Foreign Direct Investment (FDI), inflows
This interactive map shows inflows (received) of foreign direct investment at the country-level, in million US dollars. Global foreign direct investment inflows ...4.84 rating | 56,343 views | Discuss this15 years ago -
Economic
Central Bank Current Interest Rates by Country
This map shows the central bank current interest rates by country. What is Central Bank? A central bank, or reserve bank, or monetary authority is a public ins ...4.39 rating | 55,171 views | 4 Comments15 years ago -
Economic
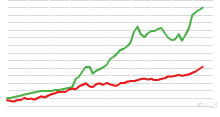
World Bicycle and Automobile Production, 1950 to Present
This chart shows World Bicycle and Automobile Production, 1950 to 2007. Note: Bicycle data include electric bicycles. 2003 bicycle data considered underestimate ...4.76 rating | 54,496 views | Discuss this16 years ago -
Economic
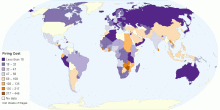
Firing Cost (Weeks of Wages)
This map shows firing cost, which is the cost of advanced notice requirements, severance payments, and penalties due when terminating a redundant worker, express ...4.33 rating | 53,896 views | Discuss this15 years ago -
Economic
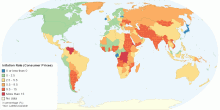
Current Inflation Rate (Consumer Prices) by Country
This map shows current Inflation Rate (consumer prices) by country. It is the annual percent change in consumer prices compared with the previous year's cons ...4.70 rating | 43,673 views | 1 Comment15 years ago -
Economic
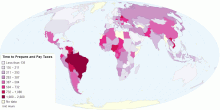
Time to Prepare and Pay Taxes (Hours)
This map indicates the time, in hours per year, it takes to prepare, file, and pay (or withhold) three major types of taxes: the corporate income tax, the value ...4.61 rating | 43,263 views | Discuss this15 years ago -
Economic
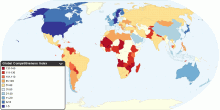
Global Competitiveness Index
This map shows 2010-2011 Global Competitiveness Index (GCI) in 139 major and emerging economies from all of the world's regions. The GCI, a highly comprehensive ...4.49 rating | 39,148 views | 3 Comments16 years ago -
Economic
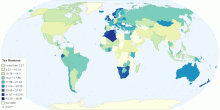
Total Tax Revenue as a Percentage of Gross Domestic ...
This map shows total tax revenue as a percentage of Gross Domestic Product (GDP). Current world average tax revenue: 15.97% of world GDP Tax revenue refers to ...4.56 rating | 35,078 views | 1 Comment15 years ago -
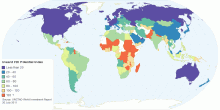
Economic
Country Rankings by Inward FDI Potential Index
This interactive map shows current rankings by Inward Foreign Direct Investment (FDI) Potential Index. The Inward FDI Potential Index captures several factors&nb ...4.33 rating | 33,970 views | Discuss this15 years ago -
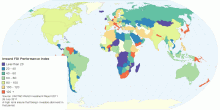
Economic
Country Rankings by Inward FDI Performance Index
This interactive map shows current rankings by Inward Foreign Direct Investment (FDI) performance index. Inward FDI Performance Index, which measures the amount ...3.67 rating | 32,534 views | 2 Comments15 years ago -
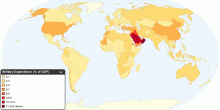
Economic
Current Worldwide Military Expenditure as a percent ...
This map shows public expenditure in a given financial year on military as a percentage of gross domestic product (GDP). Current world military expenditure: roug ...4.32 rating | 30,481 views | 2 Comments16 years ago -
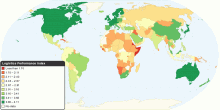
Economic
Logistics Performance Index
This map shows 2010 Logistics Performance Index (LPI). The LPI is a benchmarking tool created to help countries identify the challenges and opportunities they fa ...4.72 rating | 29,123 views | Discuss this16 years ago -
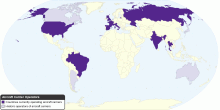
Economic
List of Aircraft Carrier Operators by Country
This map shows list of countries currently operating Aircraft Carriers. An aircraft carrier is a warship designed with a primary mission of deploying and recover ...4.28 rating | 28,484 views | 2 Comments16 years ago