-
Environment
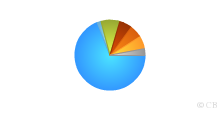
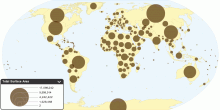
Surface Area of the Earth
This chart shows total surface area of earth. Total surface area of earth: 510,072,000 sq km Total water surface area: 70.8% (361,132,000 sq km) Tot ...4.44 rating | 383,240 views | 19 Comments16 years ago -
Environment
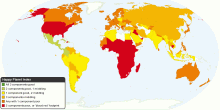
Happy Planet Index (HPI)
This map shows the overall scores from the second global compilation of the Happy Planet Index (HPI). The HPI is an index of human well-being and environmental i ...3.99 rating | 63,402 views | 9 Comments16 years ago -
Environment
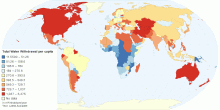
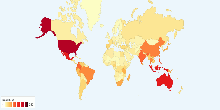
Total Water Use per capita by Country
This map shows total water withdrawal per capita by country. Water withdrawal is the quantity of water removed from available sources for use in any purpose. Wat ...3.90 rating | 397,287 views | 8 Comments15 years ago -
Environment
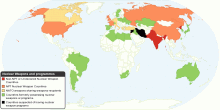
Nuclear Weapons and Programmes Around the World
This map shows current nuclear weapons or programmes around the world. There are currently nine states that have successfully detonated nuclear weapons. Five are ...4.09 rating | 30,571 views | 8 Comments16 years ago -
Environment
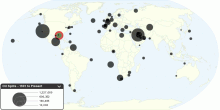
The Largest Oil Spills in History, 1901 to Present
This map shows the largest oil spills in history (1901 to Present), from tanker accidents and drilling operations, as well as a number of other notable spills. A ...4.22 rating | 234,990 views | 6 Comments16 years ago -
Environment
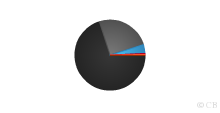
Composition of the Universe
This chart shows composition of the Universe. According to the latest observational evidence, ordinary matter, including stars, planets, dust and gas, only make ...4.38 rating | 184,237 views | 6 Comments16 years ago -
Environment
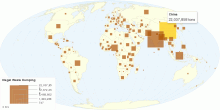
Global Illegal Waste Dumping by Country
This map shows an estimate of illegal waste dumping (in forests, public areas and elsewhere) lying around in the world by country (in tons). Total World illegal ...4.76 rating | 33,882 views | 5 Comments15 years ago -
Environment
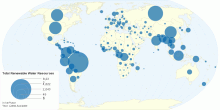
Total Renewable Water Resources by Country
This map shows total renewable water resources by country. It corresponds to the maximum theoretical yearly amount of water actually available for a country at a ...4.29 rating | 37,398 views | 4 Comments15 years ago -
Environment
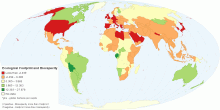
Ecological Footprint of Consumption Compared to Biocapacity
This map compares each country's total consumption Footprint with the biocapacity available within its own borders. Many countries rely, in net terms, on th ...4.14 rating | 88,326 views | 4 Comments15 years ago -
Environment
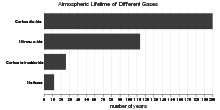
Atmospheric Lifetime of Different Greenhouse Gases
This chart shows atmospheric lifetime of different greenhouse gases. What is atmospheric lifetime? The lifetime of a greenhouse gas refers to the approximate a ...4.25 rating | 54,831 views | 3 Comments15 years ago -
Environment
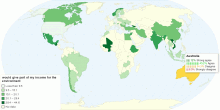
Would You Give Part of Your Income for the Environment
This map shows the result of one question about environment: Would you give part of your income for the environment from the World Values Survey (WVS). What is ...4.11 rating | 410,126 views | 3 Comments16 years ago -
Environment
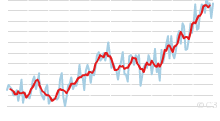
Historical Global Land-Ocean Temperatures, 1880 to Present
The time series shows the combined global land and ocean surface temperature record from 1880 to present, with the base period 1951-1980. How data were collecte ...3.97 rating | 29,117 views | 3 Comments16 years ago -
Environment
Total Surface Area by Country
This map shows Total surface area by country. Total surface area of world: 510,072,000 sq km Total area is the sum of all land and water areas delimited by inter ...3.81 rating | 49,256 views | 3 Comments16 years ago -
Environment
Threatened species of Animals in each Country
This chart shows threatened species of animals in each Red List category in each country. Red List includes Critically Endangered, Endangered and Vulnerable spec ...3.73 rating | 22,243 views | 3 Comments17 years ago -
Environment
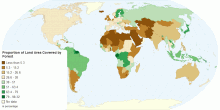
Proportion of Land Area Covered by Forest
This map shows proportion of forest area to total land area (expressed as a percentage). Forest is defined in the Food and Agriculture Organization’s (FAO ...4.32 rating | 73,260 views | 2 Comments15 years ago