-
Environment
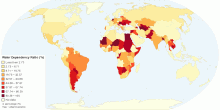
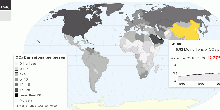
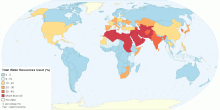
Total Renewable Water Resources Dependency Ratio by Country
This map shows the percent of total renewable water resources dependency ratio or originating outside the country. What is Dependency ratio? Dependency ratio m ...4.81 rating | 34,462 views | 2 Comments15 years ago -
Environment
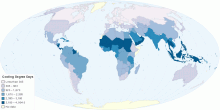
Worldwide Cooling Needs
This map shows worldwide cooling degree days. Cooling degree day (HDD) is a measurement designed to reflect the demand for energy needed to cool a home or busine ...4.64 rating | 22,477 views | 2 Comments15 years ago -
Environment
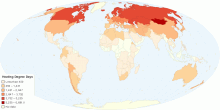
Worldwide Heating Needs
This map shows worldwide heating degree days. Heating degree day (HDD) is a measurement designed to reflect the demand for energy needed to heat a home or busine ...4.30 rating | 25,442 views | 2 Comments15 years ago -
Environment
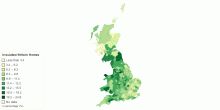
How Many British Homes Have Been Insulated by the G ...
This interactive map shows percentage of British homes have been insulated by the Government's Carbon Emissions Reduction Target (CERT). Over 2.6m homes acr ...3.40 rating | 7,524 views | 1 Comment15 years ago -
Environment
Global Carbon Dioxide Emissions
This maps shows current worldwide carbon dioxide(CO₂) emissions and per capita emissions from the consumption of energy. Data includes emissions due to the con ...4.69 rating | 39,509 views | 1 Comment15 years ago -
Environment
Threatened Species of Plants in each Country
This chart shows threatened species of plants in each Red List category in each country. Number of threatened species of plants in 2008: 10962 Current Number o ...4.14 rating | 11,807 views | 1 Comment17 years ago -
Environment
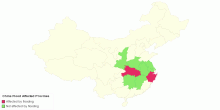
China Flood Affected Provines
This map shows flood affected area5.00 rating | 5,177 views | Discuss this15 years ago -
Environment
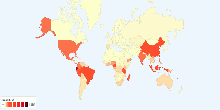
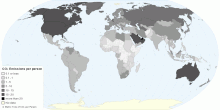
Current Worldwide Carbon Dioxide Emissions per Person
This map shows current worldwide carbon dioxide(CO₂) emissions per person from the consumption of energy. Data includes emissions due to the consumption of pet ...4.79 rating | 38,511 views | Discuss this15 years ago -
Environment
Proportion of Total Water Resources Used, percentage
This map shows worldwide surface water and ground water withdrawal as percentage of total renewable water resources. Water withdrawal is the quantity of water re ...4.64 rating | 39,358 views | Discuss this15 years ago -
Environment
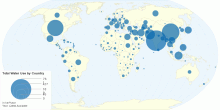
Total Water Use by Country
This map shows total water withdrawal for agricultural, industrial and municipal purposes by country. Water withdrawal is the quantity of water removed from avai ...3.97 rating | 38,328 views | Discuss this15 years ago -
Environment
Total Renewable Water Resources per capita by Country
This map shows total renewable water resources per capita by country. Current world total renewable water resources: ~24,776 m³ (cu m)/inhabitant/year ( 24 ...4.36 rating | 114,332 views | Discuss this15 years ago -
Environment
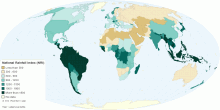
National Rainfall Index (NRI)
This map shows national rainfall index (NRI). Waht is National Rainfall Index (NRI)? A national rainfall index (NRI) is defined as the national average of the ...4.62 rating | 38,334 views | Discuss this15 years ago -
Environment
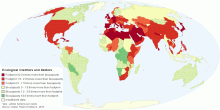
Ecological Creditors and Debtors
This map compares each country's total consumption Footprint with the biocapacity available within its own borders. World Total Biocapacity: 1.78 gha per ...3.80 rating | 44,912 views | Discuss this15 years ago -
Environment
Current Worldwide CO₂ Emissions from the Consumpt ...
This map shows current and historical worldwide carbon dioxide(CO₂) emissions from the consumption of energy. Data includes emissions due to the consumption of ...4.53 rating | 41,467 views | Discuss this15 years ago -
Environment
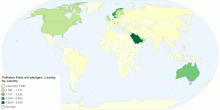
Pakistan flood aid pledged, country by country
Floods have decimated Pakistan: the number of people suffering could exceed the combined total of the 2004 Indian Ocean tsunami, the 2005 Kashmir earthquake and ...3.00 rating | 9,751 views | Discuss this15 years ago