-
Economic
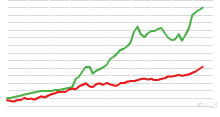
World Bicycle and Automobile Production, 1950 to Present
This chart shows World Bicycle and Automobile Production, 1950 to 2007. Note: Bicycle data include electric bicycles. 2003 bicycle data considered underestimate ...4.76 rating | 54,174 views | Discuss this16 years ago -
Economic
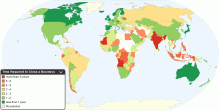
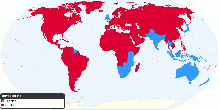
Time Required to Close a Business
This map shows time required to close a business around the world in days. This data identifies weaknesses in existing bankruptcy law and the main procedural an ...5.00 rating | 14,417 views | Discuss this16 years ago -
Information and Communication Technology
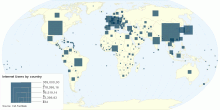
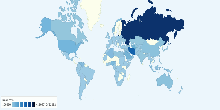
Number of Internet Users by country
This world map shows Number of Internet Users by Country. Current worldwide number of internet users: 1,832,779,793 (2009) Internet users are people with acces ...3.78 rating | 47,162 views | Discuss this15 years ago -
Economic
Global Software Piracy
This maps shows global software piracy. World Software Commercial Value of Unlicensed Software: US $51.4 billion in 2009 ($53 billion in 2008) World Software P ...4.38 rating | 25,369 views | Discuss this15 years ago -
Environment
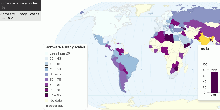
Total Renewable Water Resources per capita by Country
This map shows total renewable water resources per capita by country. Current world total renewable water resources: ~24,776 m³ (cu m)/inhabitant/year ( 24 ...4.36 rating | 114,270 views | Discuss this15 years ago -
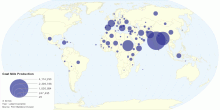
Food & Agriculture
Current Worldwide Goat Milk Production
This map shows current worldwide Goat Milk (whole, fresh) production. World Total Goat Milk Production: 15,510,411 tonnes per year4.63 rating | 29,544 views | Discuss this15 years ago -
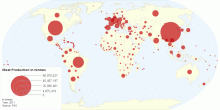
Food & Agriculture
Current Worldwide Annual Meat Production in tonnes ...
This map shows current worldwide annual Meat Production in tonnes per country. World average meat production: 727,052,012 tonnes per year.4.56 rating | 23,461 views | Discuss this13 years ago -
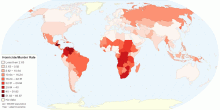
Drugs & Crime
Current Worldwide Homicide/Murder Rate
This map shows homicide or murder rates per 100,000 population around the world. Homicide is defined as unlawful death purposefully inflicted on a person by anot ...4.42 rating | 828,051 views | 79 Comments15 years ago -
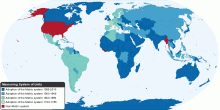
Country Info
International Measuring System of Units by Country
This map shows international measuring system of units and the chronology of the advance of metric usage around the world. Only three countries - Burma, Liberia ...4.10 rating | 352,817 views | 41 Comments16 years ago -
Country Info
Worldwide Driving Orientation by Country
This map shows worldwide which side of the road traffic drives on by country. Number of countries drive on the right-hand side of the road: 165 countries and te ...4.70 rating | 857,901 views | 28 Comments17 years ago -
Energy
Current Worldwide Natural Gas reserves
This chart shows current Natural Gas reserves in the world. Current Natural Gas reserves in the World: 184,573,964,748,442 cubic meters (cu m or m³)4.11 rating | 22,482 views | 20 Comments17 years ago -
Country Info
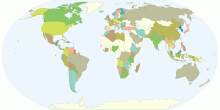
National/Iconic Animals around the world
This interactive map shows National animals around the world.4.28 rating | 379,660 views | 17 Comments15 years ago -
Country Info
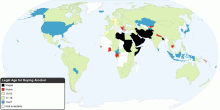
Minimum Legal Age for Buying Alcohol around the World
This chart shows legal age for purchasing alcohol around the world.4.08 rating | 66,541 views | 12 Comments16 years ago -
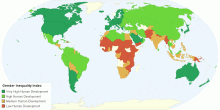
People
Gender Inequality Index(GII)
This chart shows the Global Inequality Index(GII) by Country. The Gender Inequality Index (GII) reflects women’s disadvantage in three dimensions—re ...4.14 rating | 172,568 views | 11 Comments10 years ago -
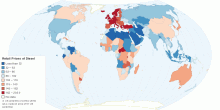
Energy
Worldwide Retail Prices of Diesel (US cents per litre)
This map shows worldwide retail prices of petroleum diesel (in US cents per litre) in more than 185 countries. Petroleum diesel, also called petrodiesel, or foss ...4.64 rating | 445,366 views | 10 Comments15 years ago