-
Information and Communication Technology
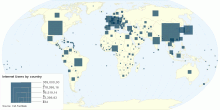
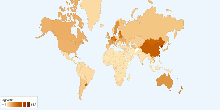
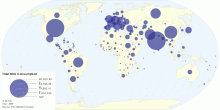
Number of Internet Users by country
This world map shows Number of Internet Users by Country. Current worldwide number of internet users: 1,832,779,793 (2009) Internet users are people with acces ...3.78 rating | 47,182 views | Discuss this15 years ago -
Drugs & Crime
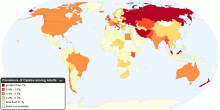
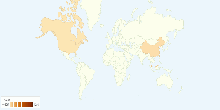
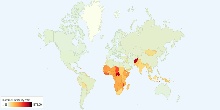
Current Worldwide Annual Prevalence of Opiates among Adults
This chart shows current worldwide annual prevalence of opiates in population aged 15-64. Number of people who used opiates at least once in year: 12.8 - 21.9 m ...4.56 rating | 46,992 views | 2 Comments16 years ago -
Energy
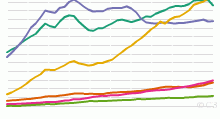
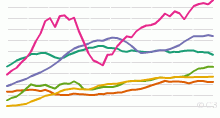
Historical Oil Consumption by Region, 1965 to Present
This chart shows the historical Oil Consumption in barrels per day - 1965 onwards. List of countries included in each region: North America includes United ...4.07 rating | 46,979 views | 2 Comments17 years ago -
Health
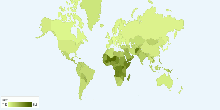
Current World Birth Rate
This chart shows current world birth rate. Current World Birth Rate: 19.95 births/1,000 people This entry gives the average annual number of births during a ye ...3.59 rating | 46,868 views | 5 Comments17 years ago -
Religion
Agnosticism Adherents by Country
This chart shows current agnosticism followers by Country. Number of Agnosticism followers in the world: 11.77% (799,190,323 people).4.26 rating | 46,572 views | 4 Comments17 years ago -
Religion
Taoism Adherents by Country
This chart shows current taoism followers by Country. Number of Taoism followers in the world: 0.09% (6,111,056 people).3.27 rating | 46,137 views | 3 Comments17 years ago -
Energy
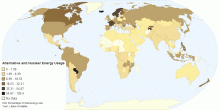
Alternative and Nuclear Energy (Percentage of Total ...
This map shows clean energy, expressed as a percentage of total energy use. Clean energy is noncarbohydrate energy that does not produce carbon dioxide whe ...4.02 rating | 46,043 views | 7 Comments15 years ago -
Health
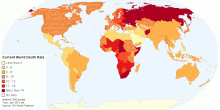
Current World Death Rate
This map shows current annual number of deaths during a year per 1,000 population at midyear; also known as crude death rate. Current World Death Rate: 7.9 deat ...3.93 rating | 45,755 views | 1 Comment14 years ago -
Energy
Historical Oil Production by Region, 1965 to Present
This chart shows the historical Oil Production - 1965 onwards. List of countries included in each region: North America includes United States,Canada and Me ...4.41 rating | 45,658 views | 5 Comments17 years ago -
People
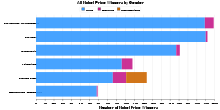
All Nobel Prize Winners by Gender
This chart shows All the Nobel Prizes and the Prize in Economic Sciences ranked by gender. The Nobel Prizes and the Prize in Economic Sciences has been awarded 8 ...4.59 rating | 45,641 views | 3 Comments15 years ago -
Population
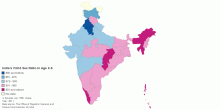
India's Child Sex Ratio in Age Group 0-6
This map shows India's child sex ratio (under 6 years) in 2011 census. India's Child Sex Ratio: 914 females per 1000 males (2011) India's Child Sex ...4.63 rating | 45,385 views | Discuss this15 years ago -
Environment
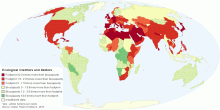
Ecological Creditors and Debtors
This map compares each country's total consumption Footprint with the biocapacity available within its own borders. World Total Biocapacity: 1.78 gha per ...3.80 rating | 44,910 views | Discuss this15 years ago -
Food & Agriculture
Current Worldwide Total Milk Consumption
This map shows current worldwide total Milk consumption (excluding butter). World Total Milk Consumption: 558,983,380 tonnes per year4.47 rating | 43,853 views | Discuss this15 years ago -
Economic
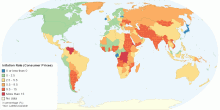
Current Inflation Rate (Consumer Prices) by Country
This map shows current Inflation Rate (consumer prices) by country. It is the annual percent change in consumer prices compared with the previous year's cons ...4.70 rating | 43,540 views | 1 Comment15 years ago -
Health
Current Worldwide Maternal Mortality Rate
This chart shows current worldwide Maternal Mortality Rate per 100,000 live births. Current World Maternal mortality rates (2008): 251 per 100,000 live births ...4.33 rating | 43,299 views | Discuss this16 years ago