-
Economic
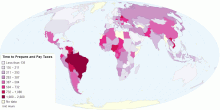
Time to Prepare and Pay Taxes (Hours)
This map indicates the time, in hours per year, it takes to prepare, file, and pay (or withhold) three major types of taxes: the corporate income tax, the value ...4.61 rating | 43,077 views | Discuss this15 years ago -
Environment
Current Worldwide CO₂ Emissions from the Consumpt ...
This map shows current and historical worldwide carbon dioxide(CO₂) emissions from the consumption of energy. Data includes emissions due to the consumption of ...4.53 rating | 41,465 views | Discuss this15 years ago -
Infrastructure
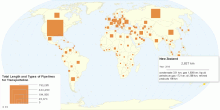
Total Length of Pipelines for Transportation by Country
This map shows list of countries by total length and types of pipelines for transporting products like natural gas, crude oil, or petroleum products. World Tota ...4.42 rating | 41,192 views | Discuss this15 years ago -
Country Info
Smoking ban around the World
This chart shows Smoking ban or Smoke-free Legislation around the world. Banning smoking in public places is a sound public health measure to protect the health ...3.85 rating | 40,945 views | 13 Comments17 years ago -
Health
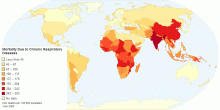
Mortality Due to Chronic Respiratory Diseases
The above map shows the age-standardized estimate of mortality by Chronic respiratory diseases per 100,000 people. Chronic respiratory diseases are chronic dise ...4.47 rating | 40,752 views | 1 Comment15 years ago -
Food & Agriculture
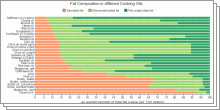
Characteristics of different Cooking Oils
These charts shows fat composition and smoke point of different Cooking Oils. Cooking oil is purified fat of plant/animal origin, which is usually liquid at room ...4.61 rating | 40,162 views | 4 Comments15 years ago -
Social
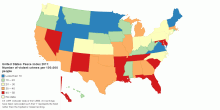
United States Peace Index 2011: Violent Crime Ranking
This map shows Number of violent crimes per 100,000 people rank in United States Peace Index (USPI) 2011. Number of violent crimes per 100,000 people rank is on ...4.29 rating | 40,093 views | 2 Comments15 years ago -
Health
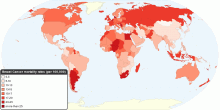
Current Worldwide Breast Cancer Mortality Rate
This map shows current worldwide Breast Cancer Age-standardised mortality rates. Breast cancer is by far the most frequent cancer among women with an estimated 1 ...4.57 rating | 39,992 views | 1 Comment16 years ago -
Food & Agriculture
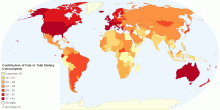
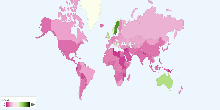
Contribution of Fats in Total Dietary Consumption
This map shows contribution of fats in total dietary energy consumption. World: 26% Developed countries: 34% Developing World: 23% Sub-Saharan Africa: 18% ...4.60 rating | 39,980 views | Discuss this15 years ago -
Social
Length of Maternity Leave around the World
This chart shows length of maternity leave around the world. Note: see note - Check Dataset for more information.4.23 rating | 39,854 views | 6 Comments17 years ago -
Food & Agriculture
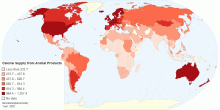
Calorie Supply Per Capita from Animal Products
This map refers to the amount of available food from animal products, expressed in calories per person, per day. Animal products include: all types of meat and f ...4.25 rating | 39,758 views | 1 Comment15 years ago -
Environment
Global Carbon Dioxide Emissions
This maps shows current worldwide carbon dioxide(CO₂) emissions and per capita emissions from the consumption of energy. Data includes emissions due to the con ...4.69 rating | 39,508 views | 1 Comment15 years ago -
Environment
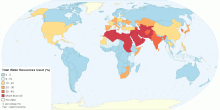
Proportion of Total Water Resources Used, percentage
This map shows worldwide surface water and ground water withdrawal as percentage of total renewable water resources. Water withdrawal is the quantity of water re ...4.64 rating | 39,348 views | Discuss this15 years ago -
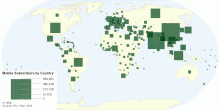
Information and Communication Technology
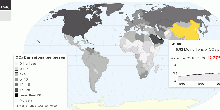
Number of Mobile Subscribers by Country
This world map shows number of mobile cellular telephone subscriptions by country. Current worldwide number of mobile cellular telephone subscriptions: 5,371,02 ...4.10 rating | 39,337 views | Discuss this15 years ago -
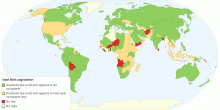
Country Info
Seat Belt Legislation
This interactive map shows existence of a national law on seat-belt use among car occupants. A seat belt or seatbelt, sometimes called a safety belt, is a safet ...4.32 rating | 39,180 views | 1 Comment15 years ago