-
Environment
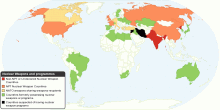
Nuclear Weapons and Programmes Around the World
This map shows current nuclear weapons or programmes around the world. There are currently nine states that have successfully detonated nuclear weapons. Five are ...4.09 rating | 30,604 views | 8 Comments16 years ago -
Economic
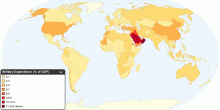
Current Worldwide Military Expenditure as a percent ...
This map shows public expenditure in a given financial year on military as a percentage of gross domestic product (GDP). Current world military expenditure: roug ...4.32 rating | 30,349 views | 2 Comments16 years ago -
Social
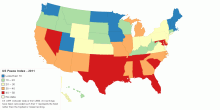
United States Peace Index 2011 - Ranking
This map shows 2011 United States Peace Index (USPI) ranking. The U.S. Peace Index is the first national peace index produced by the Institute for Economics and ...4.25 rating | 30,128 views | 5 Comments15 years ago -
People
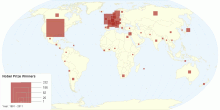
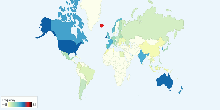
Nobel Prize Winners by Country
This map shows the total number of winners of the Nobel Prize and the Prize in Economic Sciences. The Nobel Prizes and the Prize in Economic Sciences has been aw ...4.27 rating | 30,040 views | Discuss this15 years ago -
Food & Agriculture
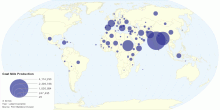
Current Worldwide Goat Milk Production
This map shows current worldwide Goat Milk (whole, fresh) production. World Total Goat Milk Production: 15,510,411 tonnes per year4.63 rating | 29,754 views | Discuss this15 years ago -
Social
Number of Cinema Admissions per Person by Country, ...
This chart shows number of cinema admissions per person in each country. Number of cinema admissions in the major countries: ~1.45 visits per person3.85 rating | 29,699 views | 4 Comments17 years ago -
Energy
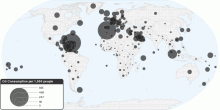
Current Worldwide Oil Consumption per 1000 people
This chart shows current oil consumption (per capita) in the world. Current Oil Consumption in the World: 31.1 barrels per day (bbl/day) per 1,000 people 1 b ...3.48 rating | 29,492 views | Discuss this16 years ago -
Social
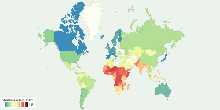
World Child Development Index
This chart shows the Child Development Index (CDI) around the world. World Performance CDI Score: 17.5 Time period: 2000-2006 Education: 11.4 H ...4.13 rating | 29,375 views | Discuss this17 years ago -
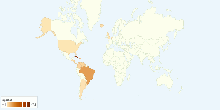
Population
Current Countries with the Adult Population in the World
This map shows current countries with the adult population in the world. Adult population means the distribution of the population in age group 15-64 years. Cur ...4.02 rating | 29,322 views | Discuss this15 years ago -
Environment
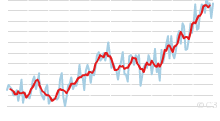
Historical Global Land-Ocean Temperatures, 1880 to Present
The time series shows the combined global land and ocean surface temperature record from 1880 to present, with the base period 1951-1980. How data were collecte ...3.97 rating | 29,198 views | 3 Comments16 years ago -
People
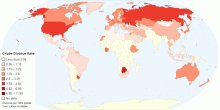
Crude Divorce Rate
This map shows crude divorce rate, that is the annual number of divorces per 1,000 population.4.13 rating | 29,099 views | Discuss this15 years ago -
Economic
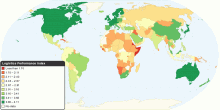
Logistics Performance Index
This map shows 2010 Logistics Performance Index (LPI). The LPI is a benchmarking tool created to help countries identify the challenges and opportunities they fa ...4.72 rating | 29,026 views | Discuss this16 years ago -
Country Info
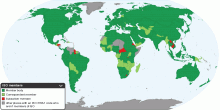
International Organization for Standardization Members
This map shows list of International Organization for Standardization (ISO) members. ISO is the world's largest developer and publisher of International Standard ...4.50 rating | 29,004 views | Discuss this16 years ago -
Religion
Spiritism Adherents by Country
This chart shows current Spiritism followers by Country. Number of Spiritism followers in the world: 0.2% (13,580,125 people).3.92 rating | 28,508 views | 2 Comments17 years ago -
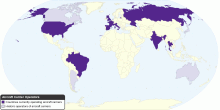
Economic
List of Aircraft Carrier Operators by Country
This map shows list of countries currently operating Aircraft Carriers. An aircraft carrier is a warship designed with a primary mission of deploying and recover ...4.28 rating | 28,348 views | 2 Comments16 years ago