-
Social
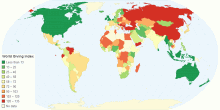
World Giving Index
This map shows World Giving Index in 135 countries around the world. The World Giving Index allows us to establish a rounded view of charitable behaviour worldwi ...4.00 rating | 12,721 views | Discuss this10 years ago -
Social
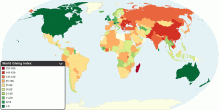
World Giving Index
This map shows World Giving Index in 153 countries around the world. The World Giving Index allows us to establish a rounded view of charitable behaviour worldwi ...3.97 rating | 52,545 views | 7 Comments15 years ago -
Others
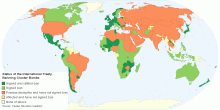
Worldwide Ban on Cluster Bombs
This interactive map shows status of an international treaty (Convention on Cluster Munitions) that prohibits the manufacture, use, transfer and stockpile of clu ...4.76 rating | 11,884 views | Discuss this14 years ago -
People
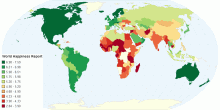
World Happiness Index
This chart shows the World Happiness Report 2015. The World Happiness Report is a measure of happiness published by the United Nations Sustainable Development S ...4.36 rating | 17,473 views | Discuss this9 years ago -
Society
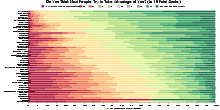
Do You Think Most People Try to Take Advantage of You?
This chart shows the result of (one question in) survey conducted by the World Values Survey (WVS) about Perceptions of Life: Do you think most people would try ...4.28 rating | 108,870 views | 15 Comments14 years ago -
Social
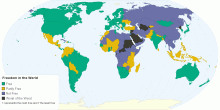
Freedom in the World
This map shows Freedom in the World in 2015. Free: 89 countries Partly Free: 54 countries Not Free: 42 countries Worst of the Worst: 9 countries ...3.95 rating | 173,394 views | Discuss this9 years ago -
Social
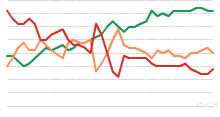
Historical Freedom in the World, 1972 to Present
This chart shows historical Freedom in the World - 1972 onwards. What is Freedom in the World? and How is the Freedom of the World calculated? Note: 1982: T ...3.61 rating | 14,799 views | Discuss this15 years ago -
Food & Agriculture
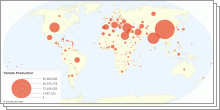
Tomato Production and Consumption by country.
This map shows tomato production and consumption by country. The tomato is now grown worldwide for its edible fruits, with thousands of cultivars having been se ...4.24 rating | 24,288 views | 1 Comment10 years ago -
Food & Agriculture
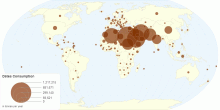
Dates Consumption By Country
This map shows dates consumption by country. Dates are a good source of various vitamins and minerals. Its a good source of energy, sugar and fiber. Essential m ...4.04 rating | 11,497 views | Discuss this10 years ago -
Drugs & Crime
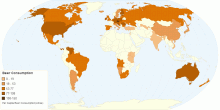
Beer Consumption by Country
This map shows per capita beer consumption by country. The Czech Republic led all other nations in per-capita beer consumption for the 20th consecutive ...4.30 rating | 22,806 views | Discuss this10 years ago -
Country Info
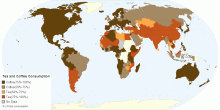
Tea and Coffee Consumption
This map shows tea and coffee consumption details.4.30 rating | 15,276 views | Discuss this10 years ago -
Country Info
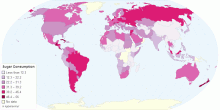
Who Has the Sweetest Tooth ?
This map shows sugar consumption per person.4.29 rating | 8,261 views | Discuss this10 years ago -
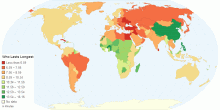
Country Info
Who Lasts the Longest?
This Map shows how long on average Porhub users around the world spend on the site by country. The data used was compiled over the Fall of 2014.4.24 rating | 24,204 views | Discuss this10 years ago -
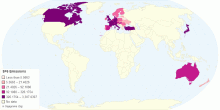
Others
Sulphur Hexafluoride SF6 Emissions by country
This chart shows the Sulphur hexafluoride (SF6) Emissions by country. Sulfur hexafluoride (SF6) is an inorganic, colorless, odorless, non-flammable, extremely p ...5.00 rating | 3,982 views | Discuss this9 years ago -
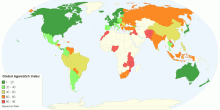
Health
Global Agewatch Index
This chart shows the Global AgeWatch Index 2015. The Global AgeWatch Index provides an analysis of results by region. It measures four key domains for older peo ...4.05 rating | 10,000 views | Discuss this9 years ago