-
Energy
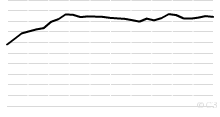
Historical Natural Gas Consumption by Region, 1965 ...
This chart shows the historical Natural Gas Consumption - 1965 onwards. List of countries included in each region: North America includes United States,Cana ...4.40 rating | 13,943 views | Discuss this17 years ago -
Energy
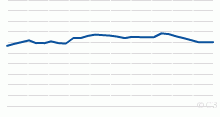
Historical World Reserves-to-production ratio of Oi ...
This chart shows the Historical World Reserves-to-production ratio of Oil - 1980 onwards. Current World Reserves-to-production ratio of Oil: 42.11 Years What D ...4.17 rating | 23,991 views | Discuss this17 years ago -
Energy
Historical World Reserves-to-production ratio of Na ...
This chart shows the Historical World Reserves-to-production ratio of Natural Gas - 1980 onwards. Current World Reserves-to-production ratio of Natural Gas: 60. ...5.00 rating | 10,800 views | Discuss this17 years ago -
Information and Communication Technology
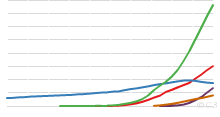
Number of Telephone Subscriptions and Internet Conn ...
This chart shows historical Number of Telephone subscriptions and Internet Connections per 100 people, World, 1975 to Present. Current World Fixed telephone ...4.59 rating | 22,470 views | Discuss this15 years ago -
People
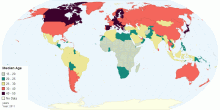
Global Median Age
This map shows the median age that divides a population into two numerically equal groups; that is, half the people are younger than this age and half are older. ...4.58 rating | 51,109 views | 2 Comments15 years ago -
Population
India's Population Density
This map shows India's population density in 2011 census. India's Population Density:382 persons per sq. km. (2011) India's Population Density: 325 ...4.01 rating | 67,033 views | 5 Comments15 years ago -
Social
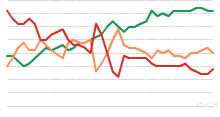
Historical Freedom in the World, 1972 to Present
This chart shows historical Freedom in the World - 1972 onwards. What is Freedom in the World? and How is the Freedom of the World calculated? Note: 1982: T ...3.67 rating | 15,963 views | Discuss this16 years ago -
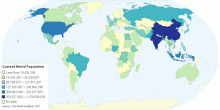
Population
Current World Population
This chart shows current world population. Current World Population: 6,790,062,2164.19 rating | 47,199 views | Discuss this17 years ago -
Population
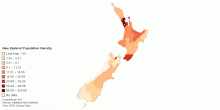
Current New Zealand Population Density
This map shows current New Zealand Population Density by regions. Total New Zealand population density: ~14.6 people per sq.km Total New Zealand population: ...4.33 rating | 33,649 views | Discuss this15 years ago -
Population
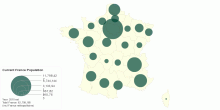
Current France Population
This interactive map shows current France population (2010 est.) Total France: 62,799,180 people (2010 est.) (incl France métropolitaine)3.40 rating | 5,337 views | Discuss this15 years ago -
Population
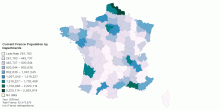
Current France Population by Departments
This interactive map shows current France population by departments (2009 est.) Total France: 62,473,876 people (2009 est) (incl France métropolitaine)4.56 rating | 7,827 views | Discuss this15 years ago -
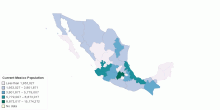
Population
Current Mexico Population
This map shows current Mexico population by state.5.00 rating | 5,711 views | Discuss this15 years ago -
Population
Current World Population Density
This chart shows current world population density. Current World Population Density: 13.31 people per km²4.13 rating | 33,988 views | 2 Comments17 years ago -
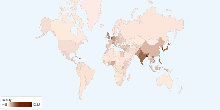
Population
Current World Population
This map shows an estimate from the US Bureau of the Census based on statistics from population censuses, vital statistics registration systems, or sample survey ...4.25 rating | 28,107 views | Discuss this10 years ago -
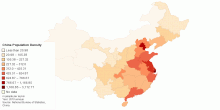
Population
Current The People's Republic of China Population Density
This map shows the People's Republic of China Population density for 2010 census. Current China population density: 139.94 people per sq.km4.29 rating | 13,234 views | Discuss this15 years ago