-
Economic
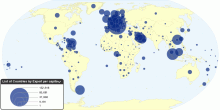
List of Countries by Exports per capita
This map shows list of countries by exports per capita. Exports means goods manufactured domestically that are bought by foreigners and sent to another county. T ...2.96 rating | 27,420 views | Discuss this16 years ago -
Drugs & Crime
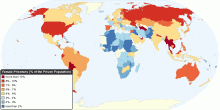
World Female Prisoners (percentage within the Priso ...
This map shows the percentage of female prisoners within each national prison population. Female prisoners includes women and girls held in penal institutions, a ...4.60 rating | 52,200 views | Discuss this16 years ago -
Sports
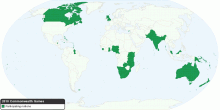
2010 Commonwealth Games Participating Nations
This map list of 2010 Commonwealth Games participating nations. The Commonwealth Games is an international, multi-sport event which is held every four years and ...3.91 rating | 16,750 views | Discuss this16 years ago -
Sports
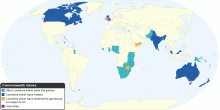
Commonwealth Games: Participants, and Locations of ...
This map shows Commonwealth games - countries which have participated, and locations of the games. The Commonwealth Games is an international, multi-sport event ...4.27 rating | 18,210 views | Discuss this16 years ago -
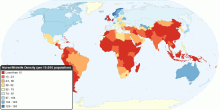
Health
Global Distribution of Nurse/Midwife per 10,000 population
This map shows the density of nursing and midwifery personnel as the number of nurses/midwives per 10,000 population, in 2000 - 2009. World Nurses/Midwives ...4.33 rating | 31,700 views | Discuss this16 years ago -
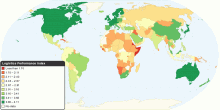
Economic
Logistics Performance Index
This map shows 2010 Logistics Performance Index (LPI). The LPI is a benchmarking tool created to help countries identify the challenges and opportunities they fa ...4.72 rating | 28,936 views | Discuss this16 years ago -
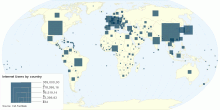
Information and Communication Technology
Number of Internet Users by country
This world map shows Number of Internet Users by Country. Current worldwide number of internet users: 1,832,779,793 (2009) Internet users are people with acces ...3.78 rating | 47,170 views | Discuss this15 years ago -
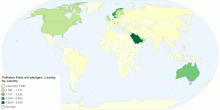
Environment
Pakistan flood aid pledged, country by country
Floods have decimated Pakistan: the number of people suffering could exceed the combined total of the 2004 Indian Ocean tsunami, the 2005 Kashmir earthquake and ...3.00 rating | 9,743 views | Discuss this15 years ago -
Others
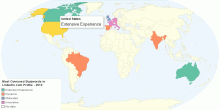
Most Overused Buzzwords in Linkedin.com Profile - 2010
The most overused buzzword in LinkedIn.com Profiles in 11 countries – 20103.00 rating | 7,237 views | Discuss this15 years ago -
Country Info
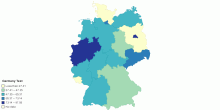
Germany Test
new map germany5.00 rating | 3,154 views | Discuss this16 years ago -
Environment
Current Worldwide CO₂ Emissions from the Consumpt ...
This map shows current and historical worldwide carbon dioxide(CO₂) emissions from the consumption of energy. Data includes emissions due to the consumption of ...4.53 rating | 41,443 views | Discuss this15 years ago -
Economic
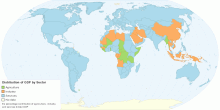
Current Worldwide Distribution of GDP by Economic Sector
This map shows worldwide distribution of gross domestic product (GDP) by economic sector. Current World Distribution of GDP by Sector: Agriculture: 5.8%; I ...4.41 rating | 111,289 views | Discuss this15 years ago -
Food & Agriculture
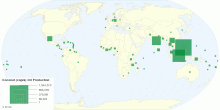
Worldwide Coconut (copra) Oil Production
This map shows worldwide coconut (copra) oil production in tonnes. Current world Coconut oil production: 3,734,208 tonnes What is Copra? Copra is dried sectio ...3.82 rating | 11,469 views | Discuss this15 years ago -
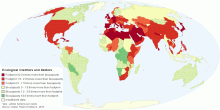
Environment
Ecological Creditors and Debtors
This map compares each country's total consumption Footprint with the biocapacity available within its own borders. World Total Biocapacity: 1.78 gha per ...3.80 rating | 44,893 views | Discuss this15 years ago -
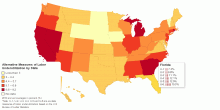
Economic
Alternative Measures of Labor Underutilization for ...
This map shows six alternative measures of labor underutilization for United States by state. United States, 2010 annual averages (percent): U-1: 5.7% U-2: ...3.67 rating | 7,195 views | Discuss this15 years ago