-
Work
Over-the-Year (2009 - 2010) Change in Unemployment ...
This map shows over-the-Year (2009 - 2010) change in unemployment rates for United States. Unemployment Rates for United States: 9.6% unemployed (2010 annual av ...3.77 rating | 20,914 views | Discuss this15 years ago -
Immigration
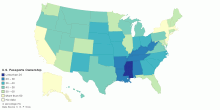
How Many Americans Own Passport? The Percentages, S ...
This map shows percentage of population has passports in each state of the United States. Percentage of population has passports in the United States: 48.36% ...4.36 rating | 96,149 views | Discuss this15 years ago -
Immigration
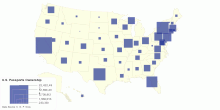
How Many Americans Own Passport? The Numbers, State ...
This map shows number of passports in each state of the United States. Total number of passports in the United States: 149,359,051 Percentage of population h ...3.29 rating | 8,296 views | Discuss this15 years ago -
Food & Agriculture
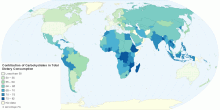
Contribution of Carbohydrates in Total Dietary Consumption
This map shows contribution of carbohydrates in total dietary energy consumption. World: 63% Developed countries: 53% Developing World: 67% Sub-Saharan Afr ...4.26 rating | 363,304 views | Discuss this15 years ago -
Food & Agriculture
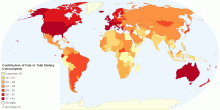
Contribution of Fats in Total Dietary Consumption
This map shows contribution of fats in total dietary energy consumption. World: 26% Developed countries: 34% Developing World: 23% Sub-Saharan Africa: 18% ...4.60 rating | 39,966 views | Discuss this15 years ago -
Health
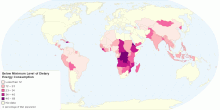
Proportion of Population Below Minimum Level of Die ...
This map shows proportion population below minimum level of dietary energy consumption. World: 13% of total population (848 million) Undernourishment refers to ...4.76 rating | 24,603 views | Discuss this15 years ago -
Food & Agriculture
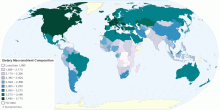
Dietary Macronutrient Composition per capita
This map shows dietary macronutrient composition per person. The dietary energy consumption per person is the amount of food, in kcal per day, for each individua ...4.30 rating | 151,260 views | Discuss this15 years ago -
Health
Population Below Minimum Level of Dietary Energy Co ...
This map shows population below minimum level of dietary energy consumption. World: 848 million (13% of total population) Undernourishment refers to the condit ...3.67 rating | 19,515 views | Discuss this15 years ago -
Social
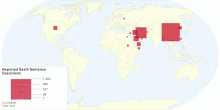
Reported Death Sentence Executions
This map shows death sentence executions in 2011.5.00 rating | 19,538 views | Discuss this14 years ago -
Economic
Global Software Piracy
This maps shows global software piracy. World Software Commercial Value of Unlicensed Software: US $51.4 billion in 2009 ($53 billion in 2008) World Software P ...4.38 rating | 25,369 views | Discuss this15 years ago -
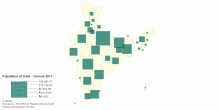
Population
Current Population of India
This map shows current population of India in 2011 census. Census 2011 is the 15th Census of India since 1872. Office of the Registrar General and Census Commiss ...3.77 rating | 17,912 views | Discuss this15 years ago -
Population
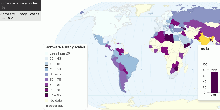
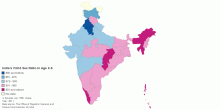
India's Child Sex Ratio in Age Group 0-6
This map shows India's child sex ratio (under 6 years) in 2011 census. India's Child Sex Ratio: 914 females per 1000 males (2011) India's Child Sex ...4.63 rating | 45,356 views | Discuss this15 years ago -
Population
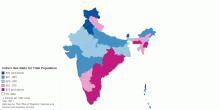
India's Sex Ratio for Total Population
This map shows India's Sex Ratio for total population in 2011 Census. India's Sex Ratio: 940 females per 1000 males (2011) India's Sex Ratio: 933 f ...4.74 rating | 109,668 views | Discuss this15 years ago -
Population
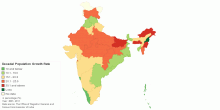
India's Decadal Population Growth Rate
This map shows India's decadal population growth rate, 2001 - 2011. India's decadal population growth rate: 17.6% (2001 - 2011) India's decadal pop ...4.24 rating | 38,111 views | Discuss this15 years ago -
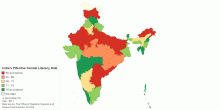
Population
India's Effective Female Literacy Rate
This map shows India's effective female Literacy Rate in 2011 census. India's effective female Literacy Rate: 65.5%4.49 rating | 15,868 views | Discuss this15 years ago