-
Country Info
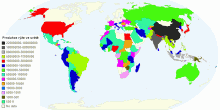
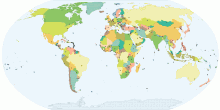
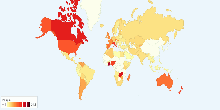
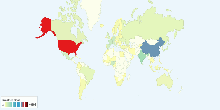
Produkce rýže ve světě
Produkce rýže ve světě pro rok 20175.00 rating | 1,888 views | Discuss this6 years ago -
Population
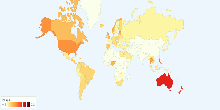
Current World Population Growth Rate
This chart shows current world population growth rate. Current World Population Growth Rate: 1.17%3.42 rating | 48,113 views | 7 Comments16 years ago -
Energy
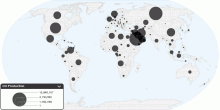
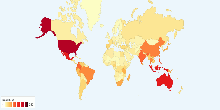
Current Worldwide Oil Production
This chart shows current oil production in the world. Current Oil Production in the World: 81,820,404.59 barrels per day (bbl/day) 1 barrel = (42 US gallons, 158 ...4.04 rating | 64,531 views | 13 Comments15 years ago -
Energy
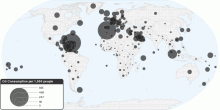
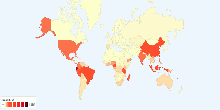
Current Worldwide Oil Consumption per 1000 people
This chart shows current oil consumption (per capita) in the world. Current Oil Consumption in the World: 31.1 barrels per day (bbl/day) per 1,000 people 1 b ...3.48 rating | 28,047 views | Discuss this15 years ago -
Country Info
Capitals of Every Country
This map shows Capitals of every country in the world. A capital is the area of a country, province, region, or state, regarded as enjoying primary status; alth ...4.37 rating | 404,441 views | 32 Comments15 years ago -
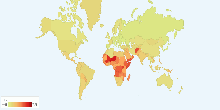
Health
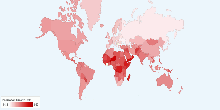
Current World Total Fertility Rate
This chart shows current world total fertility rate. Current World Total Fertility Rate: 2.58 children born/woman over her lifetime3.46 rating | 19,173 views | Discuss this16 years ago -
Health
Current World People Living with HIV/AIDS
This chart shows current world people living with HIV/AIDS. Current World People Living with HIV/AIDS: 33 million3.42 rating | 18,357 views | 3 Comments16 years ago -
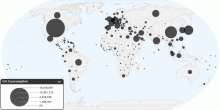
Energy
Current Worldwide Oil Consumption
This chart shows current oil consumption in the world. Current Oil Consumption in the World: 84,455,330 barrels per day (bbl/day) 1 barrel = (42 US gallons, 158. ...3.96 rating | 46,636 views | 42 Comments15 years ago -
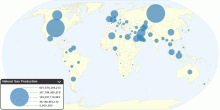
Energy
Current Worldwide Natural Gas Production
This chart shows current Natural Gas Production in the world. Current Natural Gas Production in the World: 3,065,690,558,538 cubic meters (cu m)3.81 rating | 19,260 views | Discuss this16 years ago -
Drugs & Crime
Current Worldwide Annual Prevalence of Cannabis amo ...
This chart shows current worldwide annual prevalence of cannabis in population aged 15-64. Number of people who used cannabis at least once in year: 142.6 - 190. ...4.28 rating | 37,300 views | 8 Comments16 years ago -
Drugs & Crime
Current Worldwide Annual Prevalence of Amphetamines ...
This chart shows current worldwide annual prevalence of amphetamine-type stimulants (excluding ecstasy) in population aged 15-64. Number of people who used Amphe ...3.67 rating | 14,656 views | Discuss this16 years ago -
Environment
Threatened species of Animals in each Country
This chart shows threatened species of animals in each Red List category in each country. Red List includes Critically Endangered, Endangered and Vulnerable spec ...3.73 rating | 21,349 views | 3 Comments16 years ago -
Environment
Threatened Species of Plants in each Country
This chart shows threatened species of plants in each Red List category in each country. Number of threatened species of plants in 2008: 10962 Current Number o ...4.14 rating | 11,268 views | 1 Comment16 years ago -
Social
Number of Cinema Screens by Country
This chart shows number of cinema screens in each country. Cinema screens include Indoor screens and Drive-in screens. Number of cinema screens in the maj ...3.69 rating | 79,267 views | 1 Comment16 years ago -
Social
Number of Cinema Admissions by Country, latest avai ...
This chart shows number of cinema admissions in each country. Number of cinema admissions in the major countries: ~6,870,868,430 Note: More cin ...3.62 rating | 22,648 views | Discuss this16 years ago