-
Social
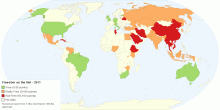
Freedom on the Net - 2011
This map shows 2011 global Freedom on the Net for 37 countries. What is Freedom on the Net? Freedom on the Net aims to measure each country's level of inte ...4.02 rating | 23,849 views | 5 Comments15 years ago -
Others
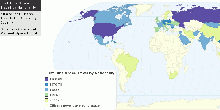
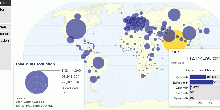
Space Travelers by Nationality
This map shows countries whose citizens have flown in space. Since the first human spaceflight by the Soviet Union (12 April 1961), citizens of 38 countries have ...3.95 rating | 18,378 views | 1 Comment15 years ago -
Social
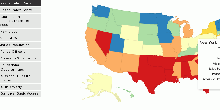
United States Peace Index 2011
This map shows 2011 United States Peace Index. Key findings: First-ever ranking of peace in the U.S. shows the nation has become more peaceful since 1995 Repo ...4.26 rating | 18,635 views | 3 Comments15 years ago -
Economic
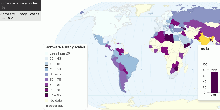
Global Software Piracy
This maps shows global software piracy. World Software Commercial Value of Unlicensed Software: US $51.4 billion in 2009 ($53 billion in 2008) World Software P ...4.38 rating | 25,389 views | Discuss this15 years ago -
Food & Agriculture
Global Nutrition Consumption and BMI
This map shows worldwide nutrition consumption and body mass index data. The dietary energy consumption per person is the amount of food, in kcal per day, for ea ...3.95 rating | 105,196 views | 7 Comments15 years ago -
Energy
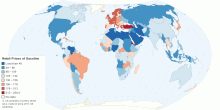
Worldwide Retail Prices of Gasoline (US cents per litre)
This map shows worldwide retail prices of gasoline (in US cents per litre) in more than 183 countries. Gasoline (also known as a petrol) refer to super gasoline ...4.59 rating | 254,501 views | 14 Comments15 years ago -
Energy
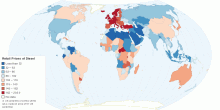
Worldwide Retail Prices of Diesel (US cents per litre)
This map shows worldwide retail prices of petroleum diesel (in US cents per litre) in more than 185 countries. Petroleum diesel, also called petrodiesel, or foss ...4.64 rating | 445,400 views | 10 Comments15 years ago -
Infrastructure
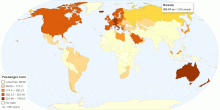
Worldwide Passenger Cars (per 1,000 people)
This map shows worldwide passenger cars, per 1000 people. Current world passenger cars: 131.64 per 1000 people What is passenger cars? Passenger cars refer to ...4.15 rating | 91,283 views | 11 Comments15 years ago -
Work
Over-the-Year (2009 - 2010) Change in Unemployment ...
This map shows over-the-Year (2009 - 2010) change in unemployment rates for United States. Unemployment Rates for United States: 9.6% unemployed (2010 annual av ...3.77 rating | 20,946 views | Discuss this15 years ago -
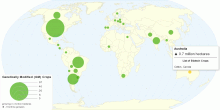
Food & Agriculture
Global Distribution of Genetically Modified (GM) Crops
This map shows global distribution of Genetically Modified (GM) crops. Current World hectarage of biotech crops: 148.6 million hectares in 2010 World hectara ...4.37 rating | 77,813 views | 2 Comments15 years ago -
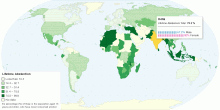
Drugs & Crime
Worldwide Lifetime Alcohol Abstention
This map shows worldwide lifetime alcohol abstention, which is the opposite of alcohol consumption. Current world lifetime abstention: 45% (men: 35%; women:55%) ...4.28 rating | 37,961 views | 2 Comments15 years ago -
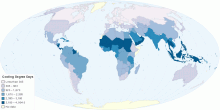
Environment
Worldwide Cooling Needs
This map shows worldwide cooling degree days. Cooling degree day (HDD) is a measurement designed to reflect the demand for energy needed to cool a home or busine ...4.64 rating | 22,492 views | 2 Comments15 years ago -
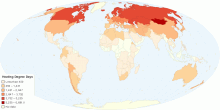
Environment
Worldwide Heating Needs
This map shows worldwide heating degree days. Heating degree day (HDD) is a measurement designed to reflect the demand for energy needed to heat a home or busine ...4.30 rating | 25,458 views | 2 Comments15 years ago -
Drugs & Crime
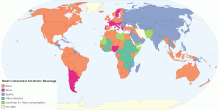
Most Consumed Alcoholic Beverage by Country
This map shows worldwide distribution of most consumed alcoholic (beer, wine, spirits or other alcoholic) beverages, in litres of pure alcohol. Key findings for ...4.53 rating | 763,146 views | 3 Comments15 years ago -
Drugs & Crime
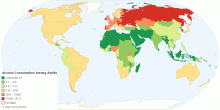
Current Worldwide Alcohol Consumption Among Adults
This chart shows alcohol consumption among adults aged ≥ 15 years in litres per person per year. Current worldwide alcohol consumption among adults: 6.13 lit ...4.47 rating | 238,590 views | 3 Comments15 years ago