-
Energy
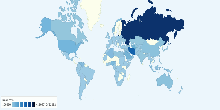
Current Worldwide Natural Gas reserves
This chart shows current Natural Gas reserves in the world. Current Natural Gas reserves in the World: 184,573,964,748,442 cubic meters (cu m or m³)4.11 rating | 21,606 views | 20 Comments16 years ago -
Energy
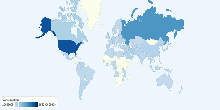
Current Worldwide Natural Gas Consumption
This chart shows current Natural Gas Consumption in the world. Current Natural Gas Consumption in the World: 3,015,443,467,227 cubic meters (m³)4.03 rating | 13,149 views | 4 Comments16 years ago -
Energy
Current Worldwide Natural Gas Consumption per capita
This chart shows current Natural Gas Consumption in the world. Current Natural Gas Consumption in the World: 444.1 cubic meters (m³) per capita4.13 rating | 12,716 views | Discuss this16 years ago -
Energy
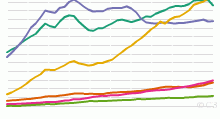
Historical Oil Consumption by Region, 1965 to Present
This chart shows the historical Oil Consumption in barrels per day - 1965 onwards. List of countries included in each region: North America includes United ...4.07 rating | 45,112 views | 2 Comments16 years ago -
Energy
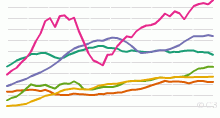
Historical Oil Production by Region, 1965 to Present
This chart shows the historical Oil Production - 1965 onwards. List of countries included in each region: North America includes United States,Canada and Me ...4.41 rating | 44,085 views | 5 Comments16 years ago -
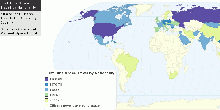
Society
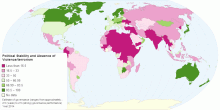
Political Stability and Absence of Violence/terrorism
This map shows "Political Stability and Absence of Violence/Terrorism", a dimension of governances in Worldwide Governance Indicators (WGI) project by ...3.86 rating | 27,531 views | Discuss this9 years ago -
Others
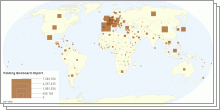
Folding Boxboard Import,Export & Production by country
This chart shows folding boxboard import,export & production by country. Folding boxboard, also referred to as FBB or by the DIN Standard 19303 codes of GC ...5.00 rating | 4,412 views | Discuss this10 years ago -
Country Info
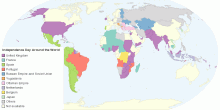
Independence Day Around the World
This map shows Independence Day around the world. An Independence Day is an annual celebration commemorating the anniversary of a nation's assumption of ind ...3.95 rating | 91,916 views | 13 Comments14 years ago -
Health
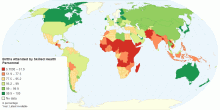
Percentage of Births Attended by Skilled Health Personnel
This map shows percentage of deliveries attended by health personnel(doctors, nurses or midwives) trained in providing life saving obstetric care, including givi ...4.31 rating | 17,674 views | 4 Comments14 years ago -
Health
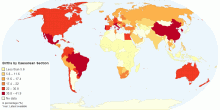
Percentage of Births by Caesarean Section
This map shows percentage of births by caesarean section among all live births in a given time period.4.63 rating | 37,123 views | Discuss this14 years ago -
Social
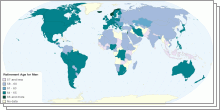
Worldwide Retirement ages
This collection of interactive maps shows the statutory retirement age and minimum pensionable age at the country-level.4.38 rating | 188,750 views | 1 Comment14 years ago -
Country Info
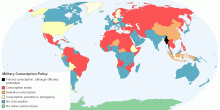
Military Conscription Policy by Country
This map shows the status of Conscription Policy by country. Conscription (also known as "The Draft", the "Call-up" or "National service ...4.54 rating | 246,784 views | 28 Comments14 years ago -
Health
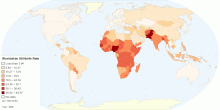
Current Worldwide Stillbirth Rate (per 1000 births)
This map shows Worldwide Stillbirth rate (per 1000 births). Stillbirth is the term used to describe the loss of a pregnancy or the birth of an infant that has di ...4.70 rating | 78,943 views | Discuss this14 years ago -
Others
Space Travelers by Nationality
This map shows countries whose citizens have flown in space. Since the first human spaceflight by the Soviet Union (12 April 1961), citizens of 38 countries have ...3.95 rating | 16,529 views | 1 Comment14 years ago -
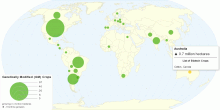
Food & Agriculture
Global Distribution of Genetically Modified (GM) Crops
This map shows global distribution of Genetically Modified (GM) crops. Current World hectarage of biotech crops: 148.6 million hectares in 2010 World hectara ...4.37 rating | 75,884 views | 2 Comments14 years ago