-
Religion
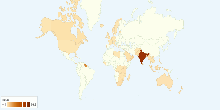
Hinduism Adherents by Country
This chart shows current hinduism adherents by Country. Number of hinduism adherents in the world: 13.26% (900,362,250 people).4.10 rating | 16,571 views | Discuss this16 years ago -
Food & Agriculture
Global Milk Production and Consumption
This map shows current worldwide Milk production and consumption. World Total Milk Production: 703,996,079 tonnes per year World Total Milk Consumption (excludin ...4.39 rating | 123,931 views | 8 Comments14 years ago -
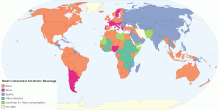
Drugs & Crime
Most Consumed Alcoholic Beverage by Country
This map shows worldwide distribution of most consumed alcoholic (beer, wine, spirits or other alcoholic) beverages, in litres of pure alcohol. Key findings for ...4.53 rating | 757,554 views | 3 Comments14 years ago -
Environment
Current Worldwide CO₂ Emissions from the Consumpt ...
This map shows current and historical worldwide carbon dioxide(CO₂) emissions from the consumption of energy. Data includes emissions due to the consumption of ...4.53 rating | 40,479 views | Discuss this14 years ago -
Religion
Babi and Baha'i faiths Adherents by Country
This chart shows current babi and baha'i faiths followers by Country. Number of Babi and Baha'i faiths followers in the world: 0.11% (7,469,069 people).4.24 rating | 19,245 views | 2 Comments16 years ago -
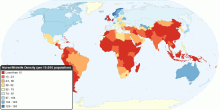
Health
Global Distribution of Nurse/Midwife per 10,000 population
This map shows the density of nursing and midwifery personnel as the number of nurses/midwives per 10,000 population, in 2000 - 2009. World Nurses/Midwives ...4.33 rating | 30,061 views | Discuss this15 years ago -
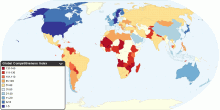
Economic
Global Competitiveness Index
This map shows 2010-2011 Global Competitiveness Index (GCI) in 139 major and emerging economies from all of the world's regions. The GCI, a highly comprehensive ...4.54 rating | 37,604 views | 3 Comments15 years ago -
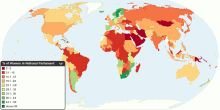
Country Info
Proportion of Seats Held by Women in National Parliaments
This map shows percentage of parliamentary seats in national parliaments held by women. World Avarage: Total number of seats in national parliaments: 38, ...4.53 rating | 48,503 views | 2 Comments15 years ago -
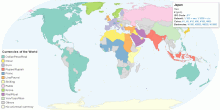
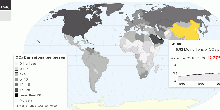
Country Info
Currencies of the World
This map shows all the currencies of the world. In economics, currency refers to physical objects generally accepted as a medium of exchange. These are usually ...4.37 rating | 107,004 views | 8 Comments14 years ago -
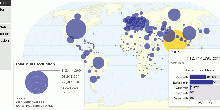
Information and Communication Technology
Internet and Telecommunications Statistics
This visualization shows number of internet users, fixed telephone lines and mobile cellular telephone subscriptions by country4.65 rating | 59,638 views | 12 Comments14 years ago -
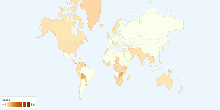
Religion
Chinese Folk Religion Adherents by Country
This chart shows current Chinese Folk Religion followers by Country. Chinese Folk Religion includes local deities, ancestor veneration, Confucian ethics, Taoism, ...3.67 rating | 31,773 views | Discuss this16 years ago -
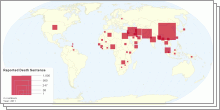
Social
Death Sentences and Executions 2011
This maps shows death sentence and executions in 2011.4.17 rating | 421,778 views | 5 Comments13 years ago -
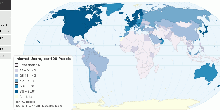
Environment
Global Carbon Dioxide Emissions
This maps shows current worldwide carbon dioxide(CO₂) emissions and per capita emissions from the consumption of energy. Data includes emissions due to the con ...4.69 rating | 38,126 views | 1 Comment14 years ago -
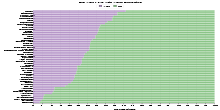
Social
Do You Live with Your Parents?
This chart shows the result of (one question) survey conducted by the World Values Survey (WVS) about housing: Do you live with your parents? What is World ...4.22 rating | 33,864 views | 1 Comment14 years ago -
Economic
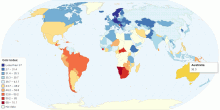
Distribution of Family Income - Gini Index
This map shows the degree of inequality in the distribution of family income (Gini index or Gini coefficient) in each country. Income distribution measure ...4.47 rating | 78,702 views | 6 Comments14 years ago