-
Energy
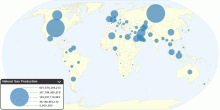
Current Worldwide Natural Gas Production
This chart shows current Natural Gas Production in the world. Current Natural Gas Production in the World: 3,065,690,558,538 cubic meters (cu m)3.86 rating | 20,152 views | Discuss this17 years ago -
Society
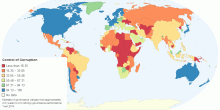
Control of Corruption
This map shows "Control of Corruption", a dimension of governances in Worldwide Governance Indicators (WGI) project by World Bank Group, which reflects ...4.38 rating | 20,146 views | 1 Comment10 years ago -
Health
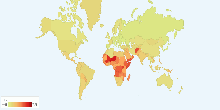
Current World Total Fertility Rate
This chart shows current world total fertility rate. Current World Total Fertility Rate: 2.58 children born/woman over her lifetime3.46 rating | 19,836 views | Discuss this17 years ago -
Education
School Life Expectancy, Primary to Tertiary around ...
This chart shows school life expectancy (years), primary to tertiary education around the world. School life expectancy (SLE) is the total number of years of sch ...4.00 rating | 19,471 views | Discuss this17 years ago -
Health
Current World People Living with HIV/AIDS
This chart shows current world people living with HIV/AIDS. Current World People Living with HIV/AIDS: 33 million3.42 rating | 18,978 views | 3 Comments17 years ago -
Sports
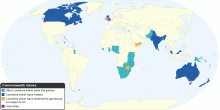
Commonwealth Games: Participants, and Locations of ...
This map shows Commonwealth games - countries which have participated, and locations of the games. The Commonwealth Games is an international, multi-sport event ...4.27 rating | 18,199 views | Discuss this16 years ago -
Sports
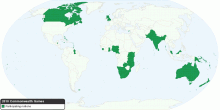
2010 Commonwealth Games Participating Nations
This map list of 2010 Commonwealth Games participating nations. The Commonwealth Games is an international, multi-sport event which is held every four years and ...3.91 rating | 16,746 views | Discuss this16 years ago -
Drugs & Crime
Current Worldwide Annual Prevalence of Amphetamines ...
This chart shows current worldwide annual prevalence of amphetamine-type stimulants (excluding ecstasy) in population aged 15-64. Number of people who used Amphe ...3.74 rating | 15,214 views | Discuss this17 years ago -
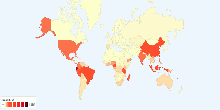
Immigration
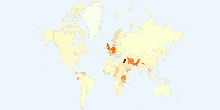
Number of Refugees per 1000 square kilometre by Country
This map shows number of refugees per 1000 square kilometre by country.4.60 rating | 15,047 views | Discuss this16 years ago -
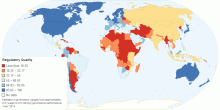
Society
Regulatory Quality
This map shows "Regulatory Quality", a dimension of governances in Worldwide Governance Indicators (WGI) project by World Bank Group, which reflects pe ...4.43 rating | 13,025 views | Discuss this10 years ago -
Environment
Threatened Species of Plants in each Country
This chart shows threatened species of plants in each Red List category in each country. Number of threatened species of plants in 2008: 10962 Current Number o ...4.14 rating | 11,798 views | 1 Comment17 years ago -
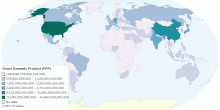
Economic
Current Worldwide Gross Domestic Product (Purchasin ...
This map shows the gross domestic product (GDP) or value of all final goods and services produced within a nation in a given year. Current World GDP (PPP): 74.5 ...4.20 rating | 11,008 views | Discuss this15 years ago -
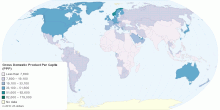
Economic
Current Worldwide Gross Domestic Product Per Capita ...
This entry shows Gross Domestic Product (GDP) on a purchasing power parity (PPP) basis divided by population as of 1 July for the same year. World Gross Domesti ...4.35 rating | 10,729 views | 1 Comment15 years ago -
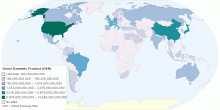
Economic
Current Worldwide Gross Domestic Product (Official ...
This map shows the gross domestic product (GDP) or value of all final goods and services produced within a nation in a given year. World GWP (gross world produc ...4.20 rating | 10,719 views | Discuss this15 years ago -
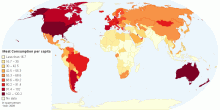
Food & Agriculture
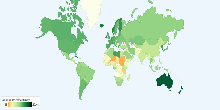
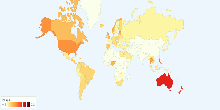
Current Worldwide Annual Meat Consumption per capita
This map shows current worldwide annual Meat Consumption per capita. World average meat consumption: 41.90 kg per person per year4.54 rating | 735,115 views | 46 Comments13 years ago