-
Energy
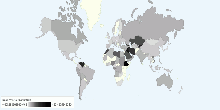
Current Worldwide Reserves-to-production ratio of Oil
This chart shows the Current World Reserves-to-production ratio of Oil. Current World Reserves-to-production ratio of Oil: 42.11 Years What Does Reserves to Pr ...4.12 rating | 26,646 views | 1 Comment17 years ago -
Energy
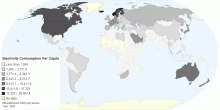
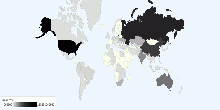
Electricity Consumption Per Capita
Electricity consumption per capita measures the average kilowatt-hours (kWh) of electrical power generated per person in a particular country or region. Note: E ...4.20 rating | 51,713 views | Discuss this15 years ago -
Energy
Current Nuclear Power Reactors in Operation by Type
This chart shows current Nuclear Power Reactors in operation by type. Number of nuclear power reactors in operation: 436 with a total net installed capacity of ...4.78 rating | 17,541 views | Discuss this17 years ago -
Energy
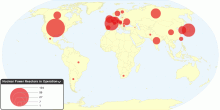
Current Nuclear Power Reactors in Operation by Country
This chart shows current Nuclear Power Reactors in operation worldwide. Number of nuclear power reactors in operation: 436 with a total net installed capacity of ...5.00 rating | 14,909 views | Discuss this17 years ago -
Energy
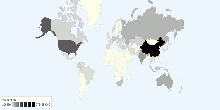
Current Worldwide Coal Production
This chart shows current Coal Production in the world. Current Coal Production in the World: 6,781,173,808 tonnes3.74 rating | 14,677 views | Discuss this17 years ago -
Energy
Current Worldwide Coal reserves
This chart shows current Coal Proved Reserves in the world. Current Coal Proved Reserves in the World: 820,001,000,000 tonnes4.06 rating | 20,485 views | Discuss this17 years ago -
Energy
Historical World Reserves-to-production ratio of Na ...
This chart shows the Historical World Reserves-to-production ratio of Natural Gas - 1980 onwards. Current World Reserves-to-production ratio of Natural Gas: 60. ...5.00 rating | 10,811 views | Discuss this17 years ago -
Energy
Historical World Reserves-to-production ratio of Oi ...
This chart shows the Historical World Reserves-to-production ratio of Oil - 1980 onwards. Current World Reserves-to-production ratio of Oil: 42.11 Years What D ...4.17 rating | 24,024 views | Discuss this17 years ago -
Energy
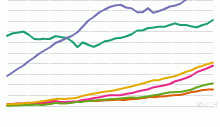
Historical Natural Gas Consumption by Region, 1965 ...
This chart shows the historical Natural Gas Consumption - 1965 onwards. List of countries included in each region: North America includes United States,Cana ...4.40 rating | 13,963 views | Discuss this17 years ago -
Energy
Historical Natural Gas Production by Region, 1970 t ...
This chart shows the historical Natural Gas Production - 1970 onwards. List of countries included in each region: North America includes United States,Canad ...4.11 rating | 13,110 views | Discuss this17 years ago -
Energy
Current Worldwide Natural Gas Consumption per capita
This chart shows current Natural Gas Consumption in the world. Current Natural Gas Consumption in the World: 444.1 cubic meters (m³) per capita4.15 rating | 13,777 views | Discuss this17 years ago -
Energy
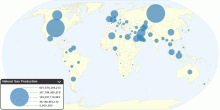
Current Worldwide Natural Gas Production
This chart shows current Natural Gas Production in the world. Current Natural Gas Production in the World: 3,065,690,558,538 cubic meters (cu m)3.86 rating | 20,199 views | Discuss this17 years ago -
Energy
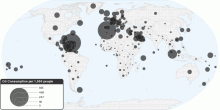
Current Worldwide Oil Consumption per 1000 people
This chart shows current oil consumption (per capita) in the world. Current Oil Consumption in the World: 31.1 barrels per day (bbl/day) per 1,000 people 1 b ...3.48 rating | 29,461 views | Discuss this16 years ago