-
Energy
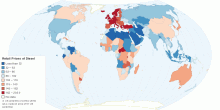
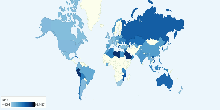
Worldwide Retail Prices of Diesel (US cents per litre)
This map shows worldwide retail prices of petroleum diesel (in US cents per litre) in more than 185 countries. Petroleum diesel, also called petrodiesel, or foss ...4.64 rating | 445,415 views | 10 Comments15 years ago -
Energy
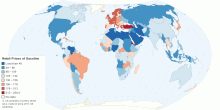
Worldwide Retail Prices of Gasoline (US cents per litre)
This map shows worldwide retail prices of gasoline (in US cents per litre) in more than 183 countries. Gasoline (also known as a petrol) refer to super gasoline ...4.59 rating | 254,541 views | 14 Comments15 years ago -
Energy
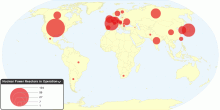
Current Nuclear Power Reactors in Operation by Type
This chart shows current Nuclear Power Reactors in operation by type. Number of nuclear power reactors in operation: 436 with a total net installed capacity of ...4.78 rating | 17,541 views | Discuss this17 years ago -
Energy
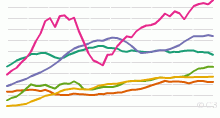
Historical Oil Production by Region, 1965 to Present
This chart shows the historical Oil Production - 1965 onwards. List of countries included in each region: North America includes United States,Canada and Me ...4.41 rating | 45,681 views | 5 Comments17 years ago -
Energy
Current Nuclear Electricity Generation by Country
This chart shows current Nuclear Electricity Generation worldwide. Current Nuclear Electricity Generation: 2601 billion kWh from 436 nuclear power reactors Not ...4.60 rating | 17,094 views | 1 Comment17 years ago -
Energy
Historical World Reserves-to-production ratio of Na ...
This chart shows the Historical World Reserves-to-production ratio of Natural Gas - 1980 onwards. Current World Reserves-to-production ratio of Natural Gas: 60. ...5.00 rating | 10,811 views | Discuss this17 years ago -
Energy
Current Nuclear Power Reactors in Operation by Country
This chart shows current Nuclear Power Reactors in operation worldwide. Number of nuclear power reactors in operation: 436 with a total net installed capacity of ...5.00 rating | 14,908 views | Discuss this17 years ago -
Energy
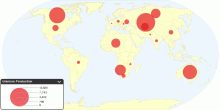
Current Worldwide Uranium Production
This map shows current worldwide uranium production from mines. A prominent use of uranium from mining is as fuel for nuclear power plants. The worldwide product ...4.33 rating | 28,008 views | 1 Comment16 years ago -
Energy
Historical Natural Gas Consumption by Region, 1965 ...
This chart shows the historical Natural Gas Consumption - 1965 onwards. List of countries included in each region: North America includes United States,Cana ...4.40 rating | 13,963 views | Discuss this17 years ago -
Energy
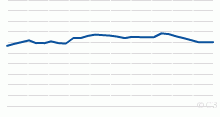
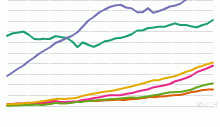
Historical Crude Oil prices, 1861 to Present
This chart shows the historical Crude Oil prices in US dollars per barrel - 1861 onwards. Note: 1861-1944 US Average. 1945-1983 Arabian Light posted at ...4.25 rating | 509,278 views | 9 Comments11 years ago -
Energy
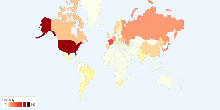
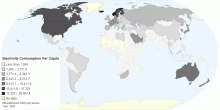
Electricity Consumption Per Capita
Electricity consumption per capita measures the average kilowatt-hours (kWh) of electrical power generated per person in a particular country or region. Note: E ...4.20 rating | 51,713 views | Discuss this15 years ago -
Energy
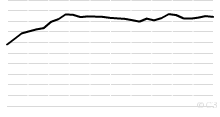
Historical World Reserves-to-production ratio of Oi ...
This chart shows the Historical World Reserves-to-production ratio of Oil - 1980 onwards. Current World Reserves-to-production ratio of Oil: 42.11 Years What D ...4.17 rating | 24,023 views | Discuss this17 years ago -
Energy
Historical Natural Gas Production by Region, 1970 t ...
This chart shows the historical Natural Gas Production - 1970 onwards. List of countries included in each region: North America includes United States,Canad ...4.11 rating | 13,110 views | Discuss this17 years ago -
Energy
Current Worldwide Natural Gas Consumption per capita
This chart shows current Natural Gas Consumption in the world. Current Natural Gas Consumption in the World: 444.1 cubic meters (m³) per capita4.15 rating | 13,777 views | Discuss this17 years ago -
Energy
Current Worldwide Reserves-to-production ratio of N ...
This chart shows the Current Worldwide Reserves-to-production ratio of Natural Gas. Current World Reserves-to-production ratio of Natural Gas: 60.35 Years What ...4.15 rating | 15,646 views | 1 Comment17 years ago