-
Food & Agriculture
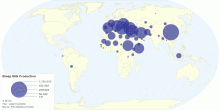
Current Worldwide Sheep Milk Production
This map shows current worldwide Sheep milk (whole, fresh) production. World Total Sheep Milk Production: 9,272,693 tonnes per year4.12 rating | 22,275 views | 2 Comments14 years ago -
Food & Agriculture
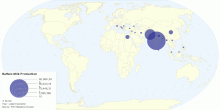
Current Worldwide Buffalo Milk Production
This map shows current worldwide Buffalo Milk (whole, fresh) production. World Total Buffalo Milk production: 92,140,146 tonnes per year4.20 rating | 22,738 views | 1 Comment14 years ago -
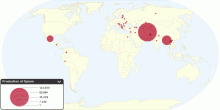
Food & Agriculture
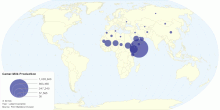
Current Worldwide Camel Milk Production
This map shows current worldwide Camel milk (whole, fresh) production. World Total Camel Milk Production: 1,840,201 tonnes per year4.50 rating | 16,937 views | 1 Comment14 years ago -
Economic
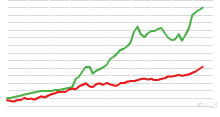
World Bicycle and Automobile Production, 1950 to Present
This chart shows World Bicycle and Automobile Production, 1950 to 2007. Note: Bicycle data include electric bicycles. 2003 bicycle data considered underestimate ...4.76 rating | 51,750 views | Discuss this15 years ago -
Food & Agriculture
Current Worldwide Goat Milk Production
This map shows current worldwide Goat Milk (whole, fresh) production. World Total Goat Milk Production: 15,510,411 tonnes per year4.63 rating | 28,000 views | Discuss this14 years ago -
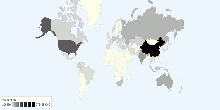
Food & Agriculture
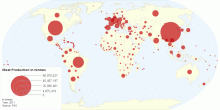
Current Worldwide Annual Meat Production in tonnes ...
This map shows current worldwide annual Meat Production in tonnes per country. World average meat production: 727,052,012 tonnes per year.4.55 rating | 21,912 views | Discuss this12 years ago -
Energy
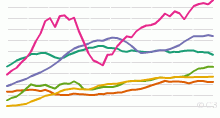
Historical Oil Production by Region, 1965 to Present
This chart shows the historical Oil Production - 1965 onwards. List of countries included in each region: North America includes United States,Canada and Me ...4.41 rating | 43,807 views | 5 Comments16 years ago -
Energy
Current Worldwide Reserves-to-production ratio of Oil
This chart shows the Current World Reserves-to-production ratio of Oil. Current World Reserves-to-production ratio of Oil: 42.11 Years What Does Reserves to Pr ...4.11 rating | 24,751 views | 1 Comment16 years ago -
Energy
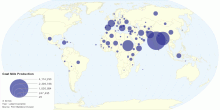
Current Worldwide Coal Production
This chart shows current Coal Production in the world. Current Coal Production in the World: 6,781,173,808 tonnes3.74 rating | 13,819 views | Discuss this16 years ago -
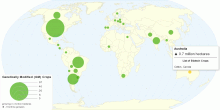
Food & Agriculture
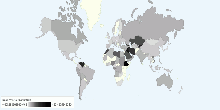
Global Distribution of Genetically Modified (GM) Crops
This map shows global distribution of Genetically Modified (GM) crops. Current World hectarage of biotech crops: 148.6 million hectares in 2010 World hectara ...4.37 rating | 75,535 views | 2 Comments14 years ago -
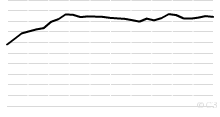
Energy
Historical World Reserves-to-production ratio of Oi ...
This chart shows the Historical World Reserves-to-production ratio of Oil - 1980 onwards. Current World Reserves-to-production ratio of Oil: 42.11 Years What D ...4.17 rating | 22,452 views | Discuss this16 years ago -
Drugs & Crime
Current Worldwide Illicit Cultivation of Opium Popp ...
This chart shows current worldwide illicit cultivation of opium poppy and production of opium. Total area under opium poppy cultivation in the major culti ...4.19 rating | 183,171 views | Discuss this15 years ago -
Food & Agriculture
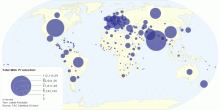
Current Worldwide Total Milk Production
This map shows current worldwide total Milk production. World Total Milk Production: 703,996,079 tonnes per year Note: Total Milk = Cow milk + Buffalo milk + G ...4.40 rating | 119,857 views | 4 Comments14 years ago -
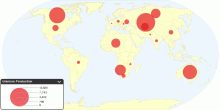
Energy
Current Worldwide Uranium Production
This map shows current worldwide uranium production from mines. A prominent use of uranium from mining is as fuel for nuclear power plants. The worldwide product ...4.32 rating | 26,010 views | 1 Comment15 years ago -
Drugs & Crime
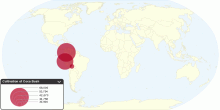
Current Worldwide Illicit Cultivation of Coca Bush ...
This chart shows current worldwide illicit cultivation of coca bush and production of cocaine. Total area under coca bush cultivation: 158,800 hectares (h ...3.22 rating | 21,352 views | Discuss this15 years ago