-
Economic
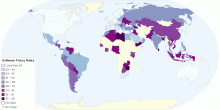
Software Piracy Rates by country
This map shows software piracy rates. World Software Piracy Rate: 43% in 2009 (41% in 2008) The rate of global software piracy climbed to 43 percent in 2009; l ...4.43 rating | 69,199 views | 3 Comments15 years ago -
Economic
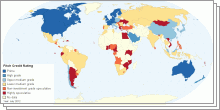
How Moody's, S&P and Fitch Rate Each Country's Cred ...
This collection of interactive maps shows credit rating for each country. What is Credit Rating? A credit rating estimates the credit worthiness of an individu ...4.41 rating | 658,824 views | 17 Comments6 years ago -
Religion
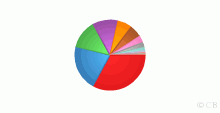
Major Religions of the World Ranked by Number of Adherents
This chart shows current major religions of the world ranked by number of adherents. Note: Click any religion(slice) to view worldwide distribution of that parti ...4.40 rating | 241,023 views | 92 Comments17 years ago -
People
Singulate Mean Age at Marriage
This map shows singulate mean age at marriage (SMAM), that is the average length of single life expressed in years among those who marry before age 50.5.00 rating | 13,895 views | Discuss this15 years ago -
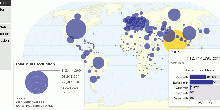
Environment
Current Worldwide CO₂ Emissions from the Consumpt ...
This map shows current and historical worldwide carbon dioxide(CO₂) emissions from the consumption of energy. Data includes emissions due to the consumption of ...4.53 rating | 41,464 views | Discuss this15 years ago -
Economic
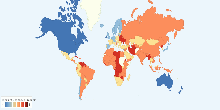
Index of Economic Freedom
This chart shows Index of Economic Freedom around the world. The Index of Economic Freedom is a series of 10 economic measurements created by the Heritage Founda ...4.57 rating | 27,716 views | 1 Comment17 years ago -
Economic
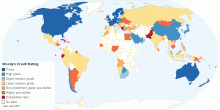
Moody's Credit Rating for each country
This map shows Moody's credit rating for each country. Moody's Analytics and Moody's Investors Service, is a credit rating agency which performs int ...4.40 rating | 599,386 views | 13 Comments14 years ago -
Economic
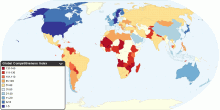
Global Competitiveness Index
This map shows 2010-2011 Global Competitiveness Index (GCI) in 139 major and emerging economies from all of the world's regions. The GCI, a highly comprehensive ...4.49 rating | 38,958 views | 3 Comments16 years ago -
Drugs & Crime
World Prison Population Rates per 100,000 of the na ...
This map shows world prison population rates per 100,000 of the national population. Current world prison population rate: 168 per 100,000 people Current world ...4.41 rating | 113,611 views | 5 Comments16 years ago -
Information and Communication Technology
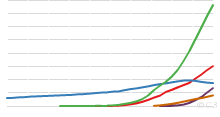
Number of Telephone Subscriptions and Internet Conn ...
This chart shows historical Number of Telephone subscriptions and Internet Connections per 100 people, World, 1975 to Present. Current World Fixed telephone ...4.59 rating | 22,471 views | Discuss this15 years ago -
Sports
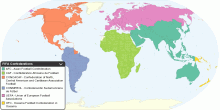
Map of the World with the Six FIFA Confederations
This map shows six confederations recognised by FIFA which oversee the game in the different continents and regions of the world. The International Federation of ...4.41 rating | 88,408 views | 1 Comment16 years ago -
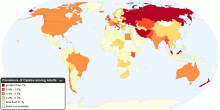
Drugs & Crime
Current Worldwide Annual Prevalence of Opiates among Adults
This chart shows current worldwide annual prevalence of opiates in population aged 15-64. Number of people who used opiates at least once in year: 12.8 - 21.9 m ...4.56 rating | 46,992 views | 2 Comments16 years ago -
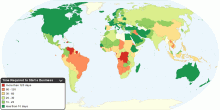
Economic
Time Required to Start a Business
This map shows time required to start a business around the world in days. Time required to start a business is the number of calendar days needed to complete th ...4.56 rating | 64,694 views | 14 Comments16 years ago -
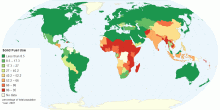
Health
Household Solid Fuel Use
This Map shows the percentage of the total population that burn solid fuels in their households, primarily for cooking fuel. Solid fuels include coal or biomass ...4.63 rating | 22,946 views | 4 Comments15 years ago -
Food & Agriculture
Global Milk Production and Consumption
This map shows current worldwide Milk production and consumption. World Total Milk Production: 703,996,079 tonnes per year World Total Milk Consumption (excludin ...4.39 rating | 127,842 views | 8 Comments15 years ago