-
Economic
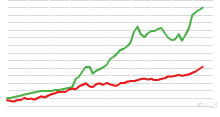
World Bicycle and Automobile Production, 1950 to Present
This chart shows World Bicycle and Automobile Production, 1950 to 2007. Note: Bicycle data include electric bicycles. 2003 bicycle data considered underestimate ...4.76 rating | 54,174 views | Discuss this16 years ago -
Economic
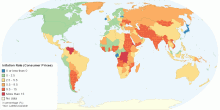
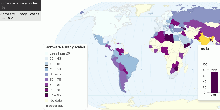
Current Inflation Rate (Consumer Prices) by Country
This map shows current Inflation Rate (consumer prices) by country. It is the annual percent change in consumer prices compared with the previous year's cons ...4.70 rating | 43,521 views | 1 Comment15 years ago -
Food & Agriculture
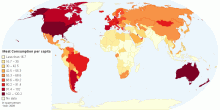
Current Worldwide Annual Meat Consumption per capita
This map shows current worldwide annual Meat Consumption per capita. World average meat consumption: 41.90 kg per person per year4.54 rating | 735,116 views | 46 Comments13 years ago -
Health
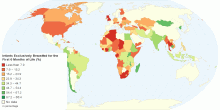
Percentage of Infants Exclusively Breastfed for the ...
This map shows percentage of Infants that are exclusively breastfed for the first six months of life. The World Health Organization (WHO) and the American Acade ...4.72 rating | 22,946 views | 2 Comments15 years ago -
Country Info
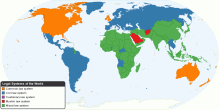
Legal Systems of the World
This map shows Legal Systems around the World. Civil law systems have drawn their inspiration largely from the Roman law heritage and which, by giving precedence ...4.49 rating | 184,929 views | 6 Comments16 years ago -
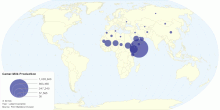
Food & Agriculture
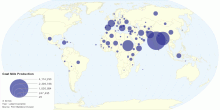
Current Worldwide Goat Milk Production
This map shows current worldwide Goat Milk (whole, fresh) production. World Total Goat Milk Production: 15,510,411 tonnes per year4.63 rating | 29,544 views | Discuss this15 years ago -
Environment
Surface Area of the Earth
This chart shows total surface area of earth. Total surface area of earth: 510,072,000 sq km Total water surface area: 70.8% (361,132,000 sq km) Tot ...4.44 rating | 382,825 views | 19 Comments16 years ago -
Food & Agriculture
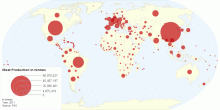
Current Worldwide Annual Meat Production in tonnes ...
This map shows current worldwide annual Meat Production in tonnes per country. World average meat production: 727,052,012 tonnes per year.4.56 rating | 23,461 views | Discuss this13 years ago -
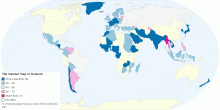
Country Info
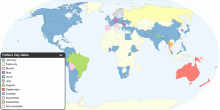
Fathers Day Dates around the world
This map show Father's Day celebration dates around the world. The Father's Day is celebrated on various days in many parts of the world, most commonly in June, ...4.42 rating | 95,704 views | 2 Comments16 years ago -
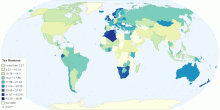
Economic
Total Tax Revenue as a Percentage of Gross Domestic ...
This map shows total tax revenue as a percentage of Gross Domestic Product (GDP). Current world average tax revenue: 15.97% of world GDP Tax revenue refers to ...4.56 rating | 34,912 views | 1 Comment15 years ago -
Education
Percentage of Female Researchers within the Total R ...
This map shows percentage of female researchers as a share of the worldwide total researchers. Researchers are defined as professionals engaged in the conception ...4.53 rating | 16,896 views | 1 Comment15 years ago -
Environment
Total Renewable Water Resources per capita by Country
This map shows total renewable water resources per capita by country. Current world total renewable water resources: ~24,776 m³ (cu m)/inhabitant/year ( 24 ...4.36 rating | 114,269 views | Discuss this15 years ago -
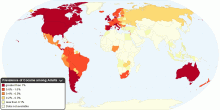
Drugs & Crime
Current Worldwide Annual Prevalence of Cocaine among Adults
This chart shows current worldwide annual prevalence of cocaine in population aged 15-64. Number of people who used cocaine at least once in year: 15 - 19.3 mil ...4.36 rating | 85,908 views | 3 Comments16 years ago -
Food & Agriculture
Current Worldwide Camel Milk Production
This map shows current worldwide Camel milk (whole, fresh) production. World Total Camel Milk Production: 1,840,201 tonnes per year4.50 rating | 18,242 views | 1 Comment15 years ago -
Economic
Global Software Piracy
This maps shows global software piracy. World Software Commercial Value of Unlicensed Software: US $51.4 billion in 2009 ($53 billion in 2008) World Software P ...4.38 rating | 25,369 views | Discuss this15 years ago