-
People
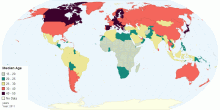
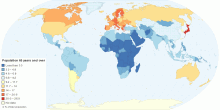
Global Median Age
This map shows the median age that divides a population into two numerically equal groups; that is, half the people are younger than this age and half are older. ...4.58 rating | 46,527 views | 2 Comments14 years ago -
Health
Current World HIV/AIDS Adult Prevalence Rate
This chart shows current world HIV/AIDS adult prevalence rate. Current World HIV/AIDS Adult Prevalence Rate: 0.8% (an estimate of the percentage of adults (aged ...4.31 rating | 15,644 views | 3 Comments16 years ago -
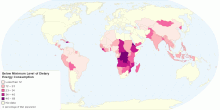
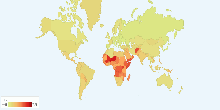
Health
Proportion of Population Below Minimum Level of Die ...
This map shows proportion population below minimum level of dietary energy consumption. World: 13% of total population (848 million) Undernourishment refers to ...4.76 rating | 23,275 views | Discuss this14 years ago -
Health
Population Below Minimum Level of Dietary Energy Co ...
This map shows population below minimum level of dietary energy consumption. World: 848 million (13% of total population) Undernourishment refers to the condit ...3.67 rating | 16,346 views | Discuss this14 years ago -
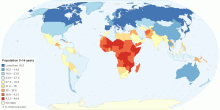
Population
Current Countries with the Youngest Population in the World
This map shows current countries with the youngest population in the world. Youngest population means the distribution of the population in age group 0-14 years. ...3.87 rating | 50,383 views | 2 Comments14 years ago -
Population
Current Countries with the Oldest Population in the World
This map shows current countries with the oldest population in the world. Oldest population means the distribution of the population in age group 65 years and ov ...4.18 rating | 82,726 views | 1 Comment14 years ago -
Population
Current Countries with the Adult Population in the World
This map shows current countries with the adult population in the world. Adult population means the distribution of the population in age group 15-64 years. Cur ...4.02 rating | 27,690 views | Discuss this14 years ago -
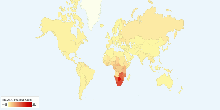
Population
India's Population Density
This map shows India's population density in 2011 census. India's Population Density:382 persons per sq. km. (2011) India's Population Density: 325 ...4.01 rating | 64,172 views | 5 Comments14 years ago -
Health
Current World Total Fertility Rate
This chart shows current world total fertility rate. Current World Total Fertility Rate: 2.58 children born/woman over her lifetime3.46 rating | 19,051 views | Discuss this16 years ago -
Population
Current World Population
This chart shows current world population. Current World Population: 6,790,062,2164.19 rating | 46,287 views | Discuss this16 years ago -
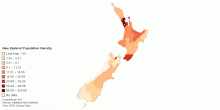
Population
Current New Zealand Population Density
This map shows current New Zealand Population Density by regions. Total New Zealand population density: ~14.6 people per sq.km Total New Zealand population: ...4.33 rating | 29,815 views | Discuss this14 years ago -
Population
Current France Population
This interactive map shows current France population (2010 est.) Total France: 62,799,180 people (2010 est.) (incl France métropolitaine)3.40 rating | 4,498 views | Discuss this14 years ago -
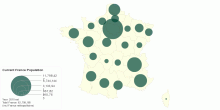
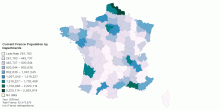
Population
Current France Population by Departments
This interactive map shows current France population by departments (2009 est.) Total France: 62,473,876 people (2009 est) (incl France métropolitaine)4.56 rating | 5,996 views | Discuss this14 years ago -
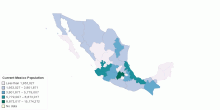
Population
Current Mexico Population
This map shows current Mexico population by state.5.00 rating | 5,015 views | Discuss this14 years ago -
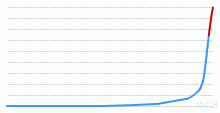
Population
Historical Population of World, 1 AD to Future
This chart shows the historical population statistics of World - 1 AD onwards.3.83 rating | 66,308 views | 5 Comments16 years ago