-
Energy
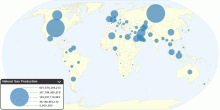
Current Worldwide Natural Gas Production
This chart shows current Natural Gas Production in the world. Current Natural Gas Production in the World: 3,065,690,558,538 cubic meters (cu m)3.81 rating | 19,023 views | Discuss this16 years ago -
Energy
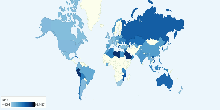
Current Worldwide Reserves-to-production ratio of N ...
This chart shows the Current Worldwide Reserves-to-production ratio of Natural Gas. Current World Reserves-to-production ratio of Natural Gas: 60.35 Years What ...4.13 rating | 14,249 views | 1 Comment16 years ago -
Energy
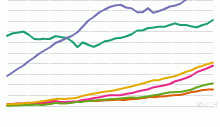
Historical Natural Gas Production by Region, 1970 t ...
This chart shows the historical Natural Gas Production - 1970 onwards. List of countries included in each region: North America includes United States,Canad ...4.11 rating | 11,931 views | Discuss this16 years ago -
Energy
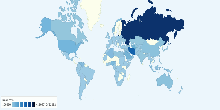
Historical World Reserves-to-production ratio of Na ...
This chart shows the Historical World Reserves-to-production ratio of Natural Gas - 1980 onwards. Current World Reserves-to-production ratio of Natural Gas: 60. ...5.00 rating | 9,797 views | Discuss this16 years ago -
Energy
Current Worldwide Natural Gas reserves
This chart shows current Natural Gas reserves in the world. Current Natural Gas reserves in the World: 184,573,964,748,442 cubic meters (cu m or m³)4.11 rating | 21,424 views | 20 Comments16 years ago -
Energy
Current Worldwide Natural Gas Consumption
This chart shows current Natural Gas Consumption in the world. Current Natural Gas Consumption in the World: 3,015,443,467,227 cubic meters (m³)4.03 rating | 12,998 views | 4 Comments16 years ago -
Energy
Current Worldwide Natural Gas Consumption per capita
This chart shows current Natural Gas Consumption in the world. Current Natural Gas Consumption in the World: 444.1 cubic meters (m³) per capita4.13 rating | 12,498 views | Discuss this16 years ago -
Energy
Historical Natural Gas Consumption by Region, 1965 ...
This chart shows the historical Natural Gas Consumption - 1965 onwards. List of countries included in each region: North America includes United States,Cana ...4.37 rating | 12,513 views | Discuss this16 years ago -
Infrastructure
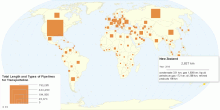
Total Length of Pipelines for Transportation by Country
This map shows list of countries by total length and types of pipelines for transporting products like natural gas, crude oil, or petroleum products. World Tota ...4.42 rating | 38,818 views | Discuss this14 years ago -
Environment
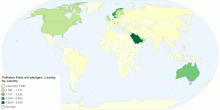
Pakistan flood aid pledged, country by country
Floods have decimated Pakistan: the number of people suffering could exceed the combined total of the 2004 Indian Ocean tsunami, the 2005 Kashmir earthquake and ...3.00 rating | 8,914 views | Discuss this14 years ago -
Food & Agriculture
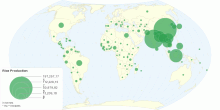
Worldwide Rice Production
This map shows global rice production. Worldwide Rice Production : 678,688,289 tonnes Worldwide Rice Area Harvested : 161,420,743 Ha World production of rice ...4.19 rating | 62,238 views | 6 Comments14 years ago -
Food & Agriculture
Current Worldwide Cow Milk Production
This map shows current worldwide Cow milk (whole, fresh) production. World Total Cow Milk Production: 585,234,624 tonnes per year4.57 rating | 30,397 views | Discuss this14 years ago -
Energy
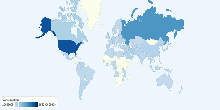
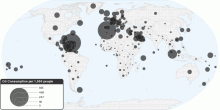
Current Worldwide Oil Consumption per 1000 people
This chart shows current oil consumption (per capita) in the world. Current Oil Consumption in the World: 31.1 barrels per day (bbl/day) per 1,000 people 1 b ...3.48 rating | 27,776 views | Discuss this15 years ago -
Energy
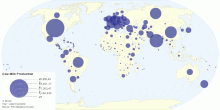
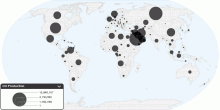
Current Worldwide Oil Production
This chart shows current oil production in the world. Current Oil Production in the World: 81,820,404.59 barrels per day (bbl/day) 1 barrel = (42 US gallons, 158 ...4.04 rating | 64,158 views | 13 Comments15 years ago -
Energy
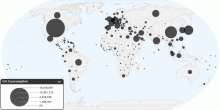
Current Worldwide Oil Consumption
This chart shows current oil consumption in the world. Current Oil Consumption in the World: 84,455,330 barrels per day (bbl/day) 1 barrel = (42 US gallons, 158. ...3.96 rating | 46,300 views | 42 Comments15 years ago