-
Society
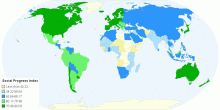
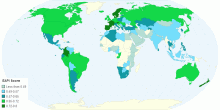
Social Progress Index 2016
This Chart Shows Social Progress Index 2016. The Social Progress Index (SPI), developed by the Social Progress Imperative, measures the extent to which c ...3.86 rating | 10,341 views | Discuss this10 years ago -
Economic
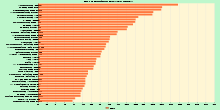
Logistics Performance Index 2016
This chart shows Logistics Performance Index - 2016. Based on a worldwide survey of global freight forwarders and express carriers, the Logistics Performance In ...4.71 rating | 9,610 views | Discuss this10 years ago -
Economic
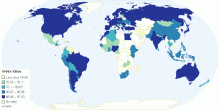
Political Globalization Index - 2016
This chart shows Political Globalization Index - 2016. Politics is the process of making uniform decisions applying to all members of a group. More narrowly, it ...4.00 rating | 6,186 views | Discuss this10 years ago -
Sports
Global Poker Index - 2016
This chart shows Global Poker Index. Poker is a family of gambling card games. All poker variants involve betting as an intrinsic part of play, and determine th ...4.33 rating | 8,030 views | Discuss this10 years ago -
Economic
Global Retail Development Index - 2016
This chart shows Global Retail Development Index - 2016. Global Retail Development Index has guided global retailers with their strategic investments since 200 ...4.00 rating | 7,176 views | Discuss this10 years ago -
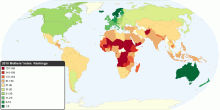
Sports
2016 Football Power Index
This chart shows 2016 Football Power Index. Football is a family of team sports that involve, to varying degrees, kicking a ball with the foot to score a goal. ...3.67 rating | 7,335 views | Discuss this9 years ago -
Country Info
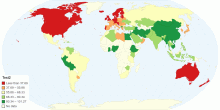
Test2
Pollution Index for Country 2016 Mid Year0.00 rating | 786 views | Discuss this9 years ago -
Health
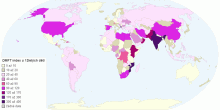
DMFT index u 12letých dětí
Tato mapa zachycuje DMFT index u dětí, kterým je dvanáct let. Tento index ukazuje kazivost zubů u určitých věkových skupin.0.00 rating | 1,462 views | Discuss this6 years ago -
Social
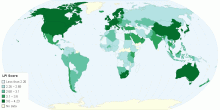
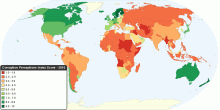
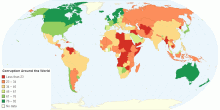
Corruption around the World
This chart shows Corruption Perceptions Index (CPI) around the world. The CPI index score on a scale from 10 (very clean) to 0 (highly corrupt). 2010 CPI key fi ...4.52 rating | 90,929 views | 8 Comments16 years ago -
Social
World Child Development Index
This chart shows the Child Development Index (CDI) around the world. World Performance CDI Score: 17.5 Time period: 2000-2006 Education: 11.4 H ...4.13 rating | 29,334 views | Discuss this16 years ago -
Social
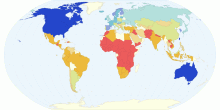
The Best and Worst Countries to Be a Mother
This map shows 2010 Mothers' Index around the world. The Mothers' Index helps document conditions for mothers and children in 160 countries (43 developed nations ...4.00 rating | 49,906 views | 8 Comments16 years ago -
Country Info
Legatum Prosperity Index Rankings
The ranking of countries in the 2012 Legatum Prosperity Index, a holistic representation of worldwide prosperity.2.33 rating | 5,322 views | Discuss this13 years ago -
Country Info
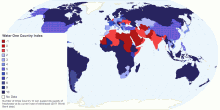
Water: One Country Index
World Bank data (2011) Reserve: Renewable internal freshwater resources (billion cubic meters) World Bank Withdrawal: Annual Freshwater Withdra ...3.29 rating | 5,445 views | Discuss this13 years ago -
Social
Corruption Around the World
This chart shows Corruption Perceptions Index (CPI) around the world. The CPI index score on a scale from 100 (very clean) to 0 (highly corrupt) What is the Cor ...4.03 rating | 14,866 views | Discuss this11 years ago -
Energy
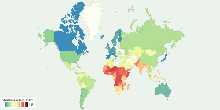
Global Energy Architecture Performance Index 2015
This chart shows the Global Energy Architecture Performance Index 2015.. The EAPI is a composite index that focuses on tracking specific indicators to measure ...5.00 rating | 4,968 views | Discuss this10 years ago