-
Health
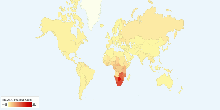
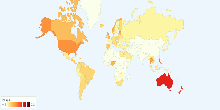
Current World HIV/AIDS Adult Prevalence Rate
This chart shows current world HIV/AIDS adult prevalence rate. Current World HIV/AIDS Adult Prevalence Rate: 0.8% (an estimate of the percentage of adults (aged ...4.31 rating | 16,295 views | 3 Comments17 years ago -
Health
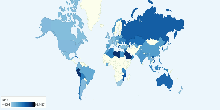
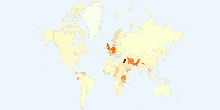
Incidence of Tuberculosis per 100,000 population
This map shows the estimated number of Tuberculosis(TB) cases arising in a given time period (expressed here as rate per 100 000 population/year). All forms of T ...4.41 rating | 16,291 views | Discuss this15 years ago -
Social
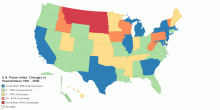
U.S. Peace Index: Changes in Peacefulness 1991 - 2009
This map shows U.S. Peace Index: Changes in Peacefulness 1991 - 2009. First-ever ranking of peace in the U.S. shows the nation has become more peaceful since 19 ...3.50 rating | 16,162 views | Discuss this15 years ago -
Social
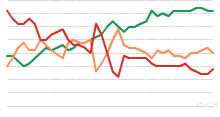
Historical Freedom in the World, 1972 to Present
This chart shows historical Freedom in the World - 1972 onwards. What is Freedom in the World? and How is the Freedom of the World calculated? Note: 1982: T ...3.67 rating | 16,020 views | Discuss this16 years ago -
Population
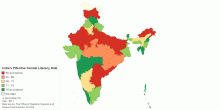
India's Effective Female Literacy Rate
This map shows India's effective female Literacy Rate in 2011 census. India's effective female Literacy Rate: 65.5%4.49 rating | 15,999 views | Discuss this15 years ago -
Energy
Current Worldwide Reserves-to-production ratio of N ...
This chart shows the Current Worldwide Reserves-to-production ratio of Natural Gas. Current World Reserves-to-production ratio of Natural Gas: 60.35 Years What ...4.15 rating | 15,926 views | 1 Comment17 years ago -
Social
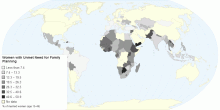
Women with Unmet Need for Family Planning
This map shows the percentage of fertile women of reproductive age (15 to 49 years) who are not using contraception and report that they do not want children or ...4.00 rating | 15,921 views | Discuss this15 years ago -
Economic
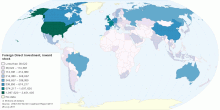
Foreign Direct Investment (FDI), inward stock
This interactive map shows the value of inward stock of foreign direct investment at the country-level, in million US dollars. Global foreign direct investment ...4.17 rating | 15,853 views | Discuss this15 years ago -
Social
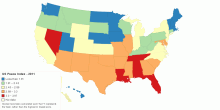
United States Peace Index 2011 - Score
This map shows 2011 United States Peace Index (USPI) Score. The United States Peace Index (USPI) is the first in a series of national peace indices that will bu ...3.67 rating | 15,839 views | 1 Comment15 years ago -
People
Nobel Memorial Prize in Economic Sciences by Country
This chart shows current Nobel Memorial Prize in Economic Sciences ranked by gender. The Nobel Memorial Prize in Economic Sciences has been awarded 67 Nobel Laur ...5.00 rating | 15,293 views | 1 Comment16 years ago -
Drugs & Crime
Current Worldwide Annual Prevalence of Amphetamines ...
This chart shows current worldwide annual prevalence of amphetamine-type stimulants (excluding ecstasy) in population aged 15-64. Number of people who used Amphe ...3.74 rating | 15,249 views | Discuss this17 years ago -
Immigration
Number of Refugees per 1000 square kilometre by Country
This map shows number of refugees per 1000 square kilometre by country.4.60 rating | 15,136 views | Discuss this16 years ago -
Economic
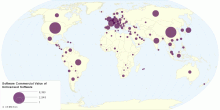
Software Piracy Losses by country
This map shows software commercial value of unlicensed software. World Software Commercial Value of Unlicensed Software: US $51.4 billion in 2009 ($52.9 b ...4.31 rating | 15,098 views | 2 Comments15 years ago -
Energy
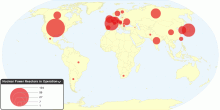
Current Nuclear Power Reactors in Operation by Country
This chart shows current Nuclear Power Reactors in operation worldwide. Number of nuclear power reactors in operation: 436 with a total net installed capacity of ...5.00 rating | 14,961 views | Discuss this17 years ago -
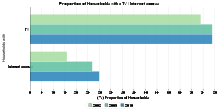
Information and Communication Technology
Proportion of households with a TV / Internet access
This chart shows proportion of households with a TV / Internet access for 2003,2009 and 2010. At the end of 2010, half a billion households worldwide (or 29.5%) ...4.20 rating | 14,837 views | Discuss this15 years ago