-
Food & Agriculture
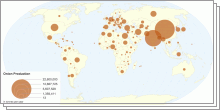
Onion Production and Consumption by country
This map shows onion production and consumption by country. Onions are cultivated and used around the world. As a foodstuff they are usually served cooked, as a ...3.83 rating | 15,262 views | Discuss this10 years ago -
Economic
Fragile States Index
This map shows 2014 Fragile States Index details. The Fragile States Index (FSI), produced by The Fund for Peace, is a critical tool in highlighting not only th ...4.57 rating | 10,222 views | Discuss this10 years ago -
Social
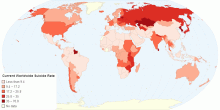
Current Worldwide Suicide Rate
This map shows current worldwide Suicide Rate in each countries. Suicide is the act of deliberately killing oneself. Current Average World Suicide Rate: 10.07 p ...4.18 rating | 24,090 views | Discuss this11 years ago -
Education
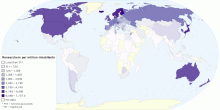
Number of Researchers per million inhabitants by Country
This map shows the distribution of researchers per million inhabitants, latest available year. Researchers are professionals engaged in the conception or creatio ...4.62 rating | 243,001 views | 16 Comments14 years ago -
Work
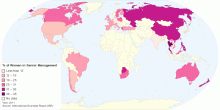
Proportion of Women in Senior Management - 2011
This map shows proportion of Women in Senior Management (2011). Global average: 20% of Women in Senior Management Research from the 2011 Grant Thornton Inter ...4.76 rating | 19,029 views | 1 Comment14 years ago -
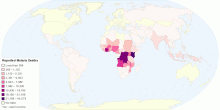
Health
Worldwide Malaria Deaths
This map shows worldwide malaria deaths, 1990 - 2009. Worldwide malaria deaths: 117,704 (Year: 2009) Today (April 25) is World Malaria Day. What is Malaria? ...4.37 rating | 229,275 views | 2 Comments14 years ago -
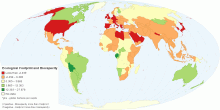
Environment
Ecological Footprint of Consumption Compared to Biocapacity
This map compares each country's total consumption Footprint with the biocapacity available within its own borders. Many countries rely, in net terms, on th ...4.16 rating | 86,573 views | 4 Comments14 years ago -
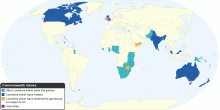
Sports
Commonwealth Games: Participants, and Locations of ...
This map shows Commonwealth games - countries which have participated, and locations of the games. The Commonwealth Games is an international, multi-sport event ...4.27 rating | 15,665 views | Discuss this15 years ago -
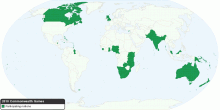
Sports
2010 Commonwealth Games Participating Nations
This map list of 2010 Commonwealth Games participating nations. The Commonwealth Games is an international, multi-sport event which is held every four years and ...3.91 rating | 13,269 views | Discuss this15 years ago -
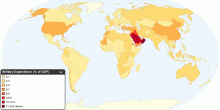
Economic
Current Worldwide Military Expenditure as a percent ...
This map shows public expenditure in a given financial year on military as a percentage of gross domestic product (GDP). Current world military expenditure: roug ...4.32 rating | 27,529 views | 2 Comments15 years ago -
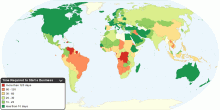
Economic
Time Required to Start a Business
This map shows time required to start a business around the world in days. Time required to start a business is the number of calendar days needed to complete th ...4.56 rating | 63,543 views | 14 Comments15 years ago -
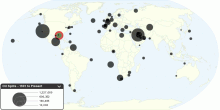
Environment
The Largest Oil Spills in History, 1901 to Present
This map shows the largest oil spills in history (1901 to Present), from tanker accidents and drilling operations, as well as a number of other notable spills. A ...4.22 rating | 231,124 views | 6 Comments15 years ago -
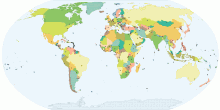
Country Info
Capitals of Every Country
This map shows Capitals of every country in the world. A capital is the area of a country, province, region, or state, regarded as enjoying primary status; alth ...4.37 rating | 404,140 views | 32 Comments15 years ago -
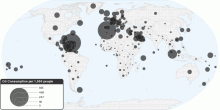
Energy
Current Worldwide Oil Consumption per 1000 people
This chart shows current oil consumption (per capita) in the world. Current Oil Consumption in the World: 31.1 barrels per day (bbl/day) per 1,000 people 1 b ...3.48 rating | 27,931 views | Discuss this15 years ago -
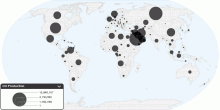
Energy
Current Worldwide Oil Production
This chart shows current oil production in the world. Current Oil Production in the World: 81,820,404.59 barrels per day (bbl/day) 1 barrel = (42 US gallons, 158 ...4.04 rating | 64,348 views | 13 Comments15 years ago