-
Health
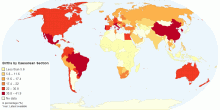
Percentage of Births by Caesarean Section
This map shows percentage of births by caesarean section among all live births in a given time period.4.63 rating | 38,297 views | Discuss this15 years ago -
Food & Agriculture
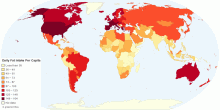
Daily Fat Intake Per Capita
This map shows dietary fat consumption per person. The dietary fat consumption per person is the amount of fat in food, in grams per day, for each individual in ...4.53 rating | 84,265 views | 4 Comments15 years ago -
Energy
Current Nuclear Power Reactors in Operation by Type
This chart shows current Nuclear Power Reactors in operation by type. Number of nuclear power reactors in operation: 436 with a total net installed capacity of ...4.78 rating | 17,524 views | Discuss this17 years ago -
Environment
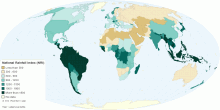
National Rainfall Index (NRI)
This map shows national rainfall index (NRI). Waht is National Rainfall Index (NRI)? A national rainfall index (NRI) is defined as the national average of the ...4.62 rating | 38,331 views | Discuss this15 years ago -
Health
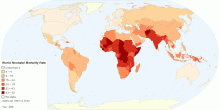
Current Worldwide Neonatal Mortality Rate (per 1000 ...
This map shows World Neonatal mortality rate. Neonatal mortality rate defined as number of deaths during the first 28 completed days of life per 1000 live births ...4.58 rating | 30,973 views | Discuss this15 years ago -
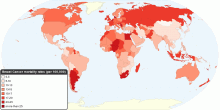
Health
Current Worldwide Breast Cancer Mortality Rate
This map shows current worldwide Breast Cancer Age-standardised mortality rates. Breast cancer is by far the most frequent cancer among women with an estimated 1 ...4.57 rating | 39,991 views | 1 Comment16 years ago -
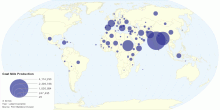
Food & Agriculture
Current Worldwide Goat Milk Production
This map shows current worldwide Goat Milk (whole, fresh) production. World Total Goat Milk Production: 15,510,411 tonnes per year4.63 rating | 29,558 views | Discuss this15 years ago -
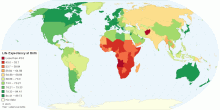
Health
Current World Life Expectancy at Birth
This map shows current world life expectancy at birth. Life expectancy at birth is the expected average number of years to be lived by a group of people born in ...4.49 rating | 132,499 views | 2 Comments15 years ago -
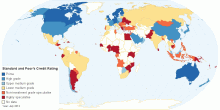
Economic
Standard & Poor's Credit Rating for each country
This map shows Standard & Poor's Credit Rating for each country. Estonia's credit rating was raised by Standard & Poor's Ratings to the se ...4.46 rating | 790,605 views | 31 Comments14 years ago -
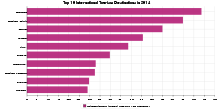
Tourism
Top 10 Most Visited Countries by Tourists in 2014
Out of a global total of 1.133 billion tourists, the top ten international tourism destinations in 2014 are shown in the above chart. Note: Images are for refer ...4.51 rating | 69,429 views | Discuss this10 years ago -
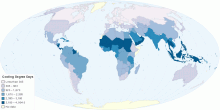
Environment
Worldwide Cooling Needs
This map shows worldwide cooling degree days. Cooling degree day (HDD) is a measurement designed to reflect the demand for energy needed to cool a home or busine ...4.64 rating | 22,476 views | 2 Comments15 years ago -
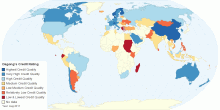
Economic
Dagong's Credit Rating for each country
This interactive map shows Dagong's credit rating for each country. Dagong Global Credit Rating is a credit rating agency based in China. It is one of the f ...4.48 rating | 88,244 views | 7 Comments15 years ago -
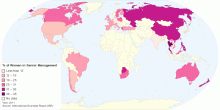
Work
Proportion of Women in Senior Management - 2011
This map shows proportion of Women in Senior Management (2011). Global average: 20% of Women in Senior Management Research from the 2011 Grant Thornton Inter ...4.76 rating | 20,430 views | 1 Comment15 years ago -
Country Info
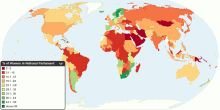
Proportion of Seats Held by Women in National Parliaments
This map shows percentage of parliamentary seats in national parliaments held by women. World Avarage: Total number of seats in national parliaments: 38, ...4.54 rating | 50,628 views | 2 Comments16 years ago -
Others
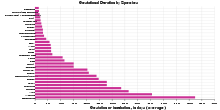
Gestational Duration by Species
This chart shows gestational or incubation duration in days by gestational age. Gestational age is the age of an embryo or fetus (or newborn infant)4.63 rating | 26,012 views | Discuss this15 years ago