-
Economic
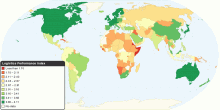
Logistics Performance Index
This map shows 2010 Logistics Performance Index (LPI). The LPI is a benchmarking tool created to help countries identify the challenges and opportunities they fa ...4.72 rating | 28,953 views | Discuss this16 years ago -
Country Info
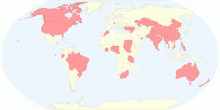
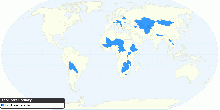
Countries Whose Capital is Not Their Largest City
This map shows countries whose capital is not their largest city.4.55 rating | 63,828 views | 5 Comments15 years ago -
Health
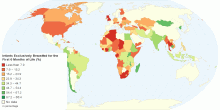
Percentage of Infants Exclusively Breastfed for the ...
This map shows percentage of Infants that are exclusively breastfed for the first six months of life. The World Health Organization (WHO) and the American Acade ...4.72 rating | 22,953 views | 2 Comments15 years ago -
People
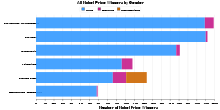
All Nobel Prize Winners by Gender
This chart shows All the Nobel Prizes and the Prize in Economic Sciences ranked by gender. The Nobel Prizes and the Prize in Economic Sciences has been awarded 8 ...4.59 rating | 45,638 views | 3 Comments15 years ago -
Drugs & Crime
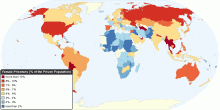
World Female Prisoners (percentage within the Priso ...
This map shows the percentage of female prisoners within each national prison population. Female prisoners includes women and girls held in penal institutions, a ...4.60 rating | 52,212 views | Discuss this16 years ago -
People
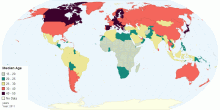
Global Median Age
This map shows the median age that divides a population into two numerically equal groups; that is, half the people are younger than this age and half are older. ...4.58 rating | 51,114 views | 2 Comments15 years ago -
Health
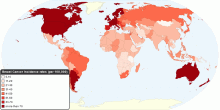
Current Worldwide Breast Cancer Incidence Rate
This map shows current worldwide Breast Cancer Incidence rates. Breast cancer is by far the most frequent cancer among women with an estimated 1.38 million new c ...4.56 rating | 61,510 views | 2 Comments16 years ago -
Food & Agriculture
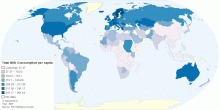
Current Worldwide Total Milk Consumption per capita
This map shows current worldwide total Milk consumption (excluding butter) per capita. World Average Milk Consumption: 108 kg per person per year4.51 rating | 265,225 views | Discuss this15 years ago -
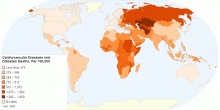
Health
Mortality due to Cardiovascular Diseases and Diabetes
The above map shows the age-standardized estimate of mortality by Cardiovascular diseases and diabetes per 100,000 people. Heart disease or cardiovascular disea ...4.68 rating | 21,849 views | 2 Comments15 years ago -
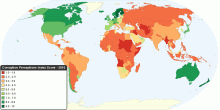
Social
Corruption around the World
This chart shows Corruption Perceptions Index (CPI) around the world. The CPI index score on a scale from 10 (very clean) to 0 (highly corrupt). 2010 CPI key fi ...4.52 rating | 90,933 views | 8 Comments16 years ago -
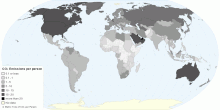
Environment
Current Worldwide Carbon Dioxide Emissions per Person
This map shows current worldwide carbon dioxide(CO₂) emissions per person from the consumption of energy. Data includes emissions due to the consumption of pet ...4.79 rating | 38,508 views | Discuss this15 years ago -
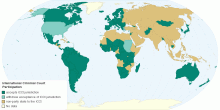
Country Info
International Criminal Court Participation
This map shows country's acceptance of International Criminal Court (ICCt). 114 countries have accepted ICCt jurisdiction 3 withdrew acceptance of ...4.79 rating | 21,715 views | Discuss this15 years ago -
Country Info
Landlocked country
This map shows worldwide Landlocked country. Number of Landlocked country: 444.56 rating | 91,524 views | 5 Comments17 years ago -
Health
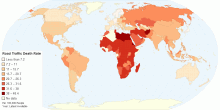
Estimated Road Traffic Fatal Injury Death Rate (Per ...
This chart shows the estimated number of road traffic deaths, per 100,000 population per year. WHO estimates about 1.2 million people die each year on the world ...4.55 rating | 53,184 views | 5 Comments15 years ago -
Country Info
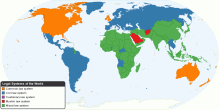
Legal Systems of the World
This map shows Legal Systems around the World. Civil law systems have drawn their inspiration largely from the Roman law heritage and which, by giving precedence ...4.49 rating | 184,989 views | 6 Comments16 years ago