-
Food & Agriculture
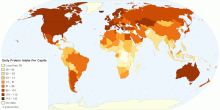
Daily Protein Intake Per Capita
This map shows dietary protein consumption per person. The dietary protein consumption per person is the amount of protein in food, in grams per day, for each in ...4.60 rating | 149,686 views | 1 Comment15 years ago -
People
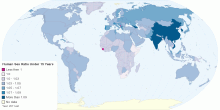
Worldwide Human Sex Ratio Under 15 Years
This map shows worldwide human sex ratio under 15 years. Sex ratio is the number of males for each female. Current world sex ratio under 15 years: 1.07:1 male(s ...4.77 rating | 31,917 views | Discuss this15 years ago -
Economic
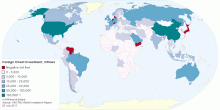
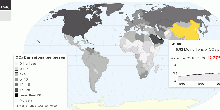
Foreign Direct Investment (FDI), inflows
This interactive map shows inflows (received) of foreign direct investment at the country-level, in million US dollars. Global foreign direct investment inflows ...4.84 rating | 56,241 views | Discuss this15 years ago -
People
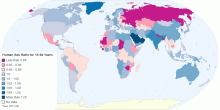
Worldwide Human Sex Ratio for 15-64 Years
This map shows worldwide human sex ratio for 15-64 Years. Sex ratio is the number of males for each female. Current world sex ratio for 15-64 Years: 1.02:1 male ...4.84 rating | 37,843 views | Discuss this15 years ago -
Country Info
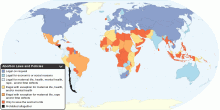
World Abortion Laws and Policies
This map shows world status of abortion laws and policies. Abortion law is legislation which pertains to the provision of abortion. Although it is commonly pract ...4.59 rating | 57,039 views | 8 Comments16 years ago -
Environment
Global Carbon Dioxide Emissions
This maps shows current worldwide carbon dioxide(CO₂) emissions and per capita emissions from the consumption of energy. Data includes emissions due to the con ...4.69 rating | 39,507 views | 1 Comment15 years ago -
Food & Agriculture
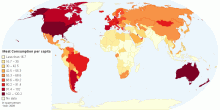
Current Worldwide Annual Meat Consumption per capita
This map shows current worldwide annual Meat Consumption per capita. World average meat consumption: 41.90 kg per person per year4.54 rating | 735,237 views | 46 Comments13 years ago -
Country Info
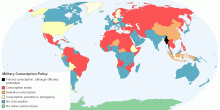
Military Conscription Policy by Country
This map shows the status of Conscription Policy by country. Conscription (also known as "The Draft", the "Call-up" or "National service ...4.54 rating | 258,869 views | 28 Comments15 years ago -
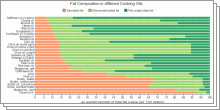
Food & Agriculture
Characteristics of different Cooking Oils
These charts shows fat composition and smoke point of different Cooking Oils. Cooking oil is purified fat of plant/animal origin, which is usually liquid at room ...4.61 rating | 40,160 views | 4 Comments15 years ago -
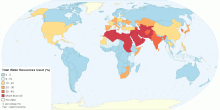
Environment
Proportion of Total Water Resources Used, percentage
This map shows worldwide surface water and ground water withdrawal as percentage of total renewable water resources. Water withdrawal is the quantity of water re ...4.64 rating | 39,345 views | Discuss this15 years ago -
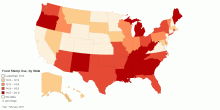
Food & Agriculture
Food Stamp Use, by State
This map shows the percent of the population on food stamps in United States America. More Americans are using food stamps, but the percent of the population en ...4.58 rating | 67,875 views | 8 Comments15 years ago -
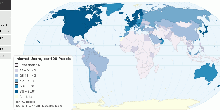
Information and Communication Technology
Internet and Telecommunications Statistics
This visualization shows number of internet users, fixed telephone lines and mobile cellular telephone subscriptions by country4.65 rating | 61,060 views | 12 Comments15 years ago -
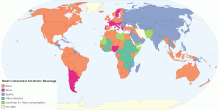
Drugs & Crime
Most Consumed Alcoholic Beverage by Country
This map shows worldwide distribution of most consumed alcoholic (beer, wine, spirits or other alcoholic) beverages, in litres of pure alcohol. Key findings for ...4.53 rating | 763,092 views | 3 Comments15 years ago -
Economic
Ease of Doing Business - Rank
Thia map shows ease of doing business index, which ranks economies from 1 to 183, with first place being the best. A high ranking means that the regulatory envir ...4.61 rating | 60,428 views | Discuss this15 years ago -
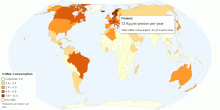
Food & Agriculture
Current Worldwide Annual Coffee Consumption per capita
This map shows Coffee consumption in kilograms, consumed annually by each person in a given country or region. Current World Total Coffee Consumption: 1.3 Kilogr ...4.51 rating | 837,691 views | 26 Comments15 years ago