-
Sports
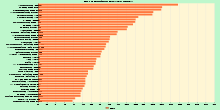
Global Poker Index - 2016
This chart shows Global Poker Index. Poker is a family of gambling card games. All poker variants involve betting as an intrinsic part of play, and determine th ...4.33 rating | 6,245 views | Discuss this9 years ago -
Economic
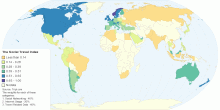
Global Retail Development Index - 2016
This chart shows Global Retail Development Index - 2016. Global Retail Development Index has guided global retailers with their strategic investments since 200 ...4.00 rating | 6,552 views | Discuss this9 years ago -
Sports
2016 Football Power Index
This chart shows 2016 Football Power Index. Football is a family of team sports that involve, to varying degrees, kicking a ball with the foot to score a goal. ...3.67 rating | 5,751 views | Discuss this8 years ago -
Social
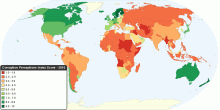
Corruption around the World
This chart shows Corruption Perceptions Index (CPI) around the world. The CPI index score on a scale from 10 (very clean) to 0 (highly corrupt). 2010 CPI key fi ...4.52 rating | 88,767 views | 8 Comments15 years ago -
Social
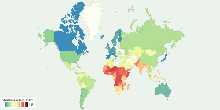
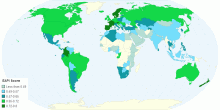
World Child Development Index
This chart shows the Child Development Index (CDI) around the world. World Performance CDI Score: 17.5 Time period: 2000-2006 Education: 11.4 H ...4.18 rating | 28,309 views | Discuss this15 years ago -
Social
The Best and Worst Countries to Be a Mother
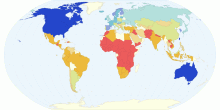
This map shows 2010 Mothers' Index around the world. The Mothers' Index helps document conditions for mothers and children in 160 countries (43 developed nations ...4.05 rating | 48,319 views | 8 Comments15 years ago -
Country Info
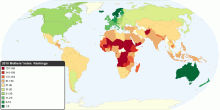
Legatum Prosperity Index Rankings
The ranking of countries in the 2012 Legatum Prosperity Index, a holistic representation of worldwide prosperity.2.33 rating | 4,841 views | Discuss this12 years ago -
Country Info
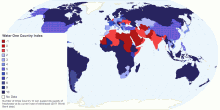
Water: One Country Index
World Bank data (2011) Reserve: Renewable internal freshwater resources (billion cubic meters) World Bank Withdrawal: Annual Freshwater Withdra ...3.29 rating | 4,840 views | Discuss this12 years ago -
Social
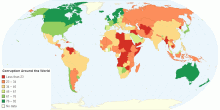
Corruption Around the World
This chart shows Corruption Perceptions Index (CPI) around the world. The CPI index score on a scale from 100 (very clean) to 0 (highly corrupt) What is the Cor ...4.03 rating | 13,051 views | Discuss this10 years ago -
Energy
Global Energy Architecture Performance Index 2015
This chart shows the Global Energy Architecture Performance Index 2015.. The EAPI is a composite index that focuses on tracking specific indicators to measure ...5.00 rating | 4,415 views | Discuss this9 years ago -
Economic
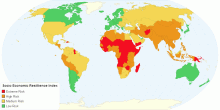
Socio Economic Resillience Index
This chart Shows Socio-economic Resillience Index by Country. Economic resilence is the ability of a local economy to retain function, employment and prosperit ...2.60 rating | 5,060 views | Discuss this9 years ago -
Education
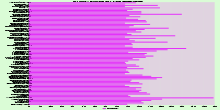
H - Index Ranking of Living Chemists
This chart shows H-index ranking of living chemists. Chemistry is a branch of physical science that studies the composition, structure, properties and change of ...2.80 rating | 19,473 views | Discuss this9 years ago -
Tourism
The Social Travel Index - A Country Perspective
This map shows the Social Travel Index created by Peter Sullivan Tripl Co-Founder. The Internet has allowed the world to become a much more global environment w ...3.67 rating | 6,778 views | 1 Comment14 years ago -
Country Info
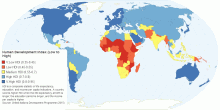
Human Development Index (Low to High)
HDI is a composite statistic of life expectancy, education, and income per capita indicators. A country scores higher HDI when the life expectancy at birth is lo ...3.00 rating | 6,381 views | Discuss this9 years ago -
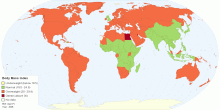
Health
Body Mass Index (BMI) by Country
This map shows World trends in age-standardized mean Body Mass Index (BMI) 199 countries over 28 years. The worldwide prevalence of obesity has nearly doubled s ...4.13 rating | 188,812 views | 11 Comments14 years ago