-
Economic
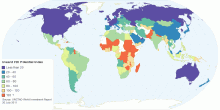
Country Rankings by Inward FDI Potential Index
This interactive map shows current rankings by Inward Foreign Direct Investment (FDI) Potential Index. The Inward FDI Potential Index captures several factors&nb ...4.33 rating | 33,970 views | Discuss this15 years ago -
Economic
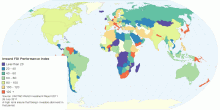
Country Rankings by Inward FDI Performance Index
This interactive map shows current rankings by Inward Foreign Direct Investment (FDI) performance index. Inward FDI Performance Index, which measures the amount ...3.67 rating | 32,534 views | 2 Comments15 years ago -
Economic
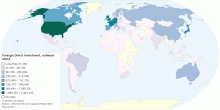
Foreign Direct Investment, outward stock
This interactive map shows the value of outward stock of foreign direct investment at the country-level, in million US dollars. Global foreign direct investment ...5.00 rating | 9,837 views | Discuss this15 years ago -
Economic
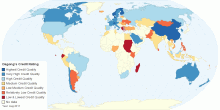
Dagong's Credit Rating for each country
This interactive map shows Dagong's credit rating for each country. Dagong Global Credit Rating is a credit rating agency based in China. It is one of the f ...4.48 rating | 88,723 views | 7 Comments15 years ago -
Economic
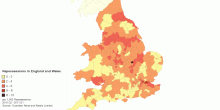
Repossessions in England and Wales (2010 Q2 - 2011 Q1)
This map shows repossessions across England and Wales during the first quarter of 2011 Repossessions across England and Wales have risen - there is a 4% increas ...5.00 rating | 3,969 views | Discuss this15 years ago -
Economic
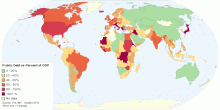
General Government Debt as Percent of GDP by Country
This interactive map shows historical data and forecast of general government gross debt (as percent of GDP) in each country. Government debt (also known as publ ...4.69 rating | 131,135 views | 11 Comments15 years ago -
Economic
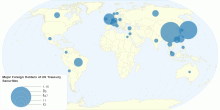
How Much Money Does America Owe Other Countries?
This interactive map shows leading foreign holders of United States Treasury Securities (at end of period - May 2011). Grand total: US $4,514 billions What is ...3.96 rating | 210,358 views | 34 Comments15 years ago -
Economic
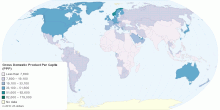
Current Worldwide Gross Domestic Product Per Capita ...
This entry shows Gross Domestic Product (GDP) on a purchasing power parity (PPP) basis divided by population as of 1 July for the same year. World Gross Domesti ...4.35 rating | 10,809 views | 1 Comment15 years ago -
Economic
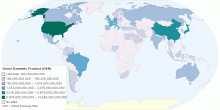
Current Worldwide Gross Domestic Product (Official ...
This map shows the gross domestic product (GDP) or value of all final goods and services produced within a nation in a given year. World GWP (gross world produc ...4.20 rating | 10,798 views | Discuss this15 years ago -
Economic
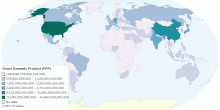
Current Worldwide Gross Domestic Product (Purchasin ...
This map shows the gross domestic product (GDP) or value of all final goods and services produced within a nation in a given year. Current World GDP (PPP): 74.5 ...4.20 rating | 11,104 views | Discuss this15 years ago -
Economic
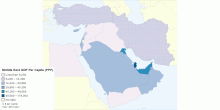
Middle East GDP Per Capita (PPP)
This map shows Middle East GDP on a purchasing power parity basis divided by population as of 1 July for the year 2010.3.00 rating | 10,889 views | Discuss this15 years ago -
Economic
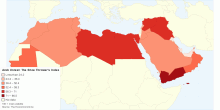
Arab Unrest: The Shoe Thrower's Index
This map shows the Shoe Thrower's Index. The Shoe Thrower's Index is an index of unrest in the Arab world published by the Economist Newspaper Limited. ...4.33 rating | 6,092 views | Discuss this15 years ago -
Economic
Central Bank Current Interest Rates by Country
This map shows the central bank current interest rates by country. What is Central Bank? A central bank, or reserve bank, or monetary authority is a public ins ...4.39 rating | 55,171 views | 4 Comments15 years ago -
Economic
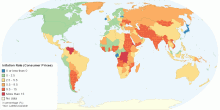
Current Inflation Rate (Consumer Prices) by Country
This map shows current Inflation Rate (consumer prices) by country. It is the annual percent change in consumer prices compared with the previous year's cons ...4.70 rating | 43,673 views | 1 Comment15 years ago -
Economic
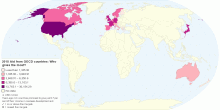
2010 Aid from OECD countries: Who gives the most?
This map shows 2010 Official Development Assistance by OECD member countries. 41 years ago (in 1969) rich countries promised to give 0.7 per cent of their income ...2.60 rating | 6,331 views | Discuss this15 years ago