-
Food & Agriculture
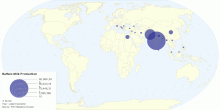
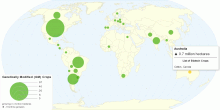
Current Worldwide Buffalo Milk Production
This map shows current worldwide Buffalo Milk (whole, fresh) production. World Total Buffalo Milk production: 92,140,146 tonnes per year4.20 rating | 24,615 views | 1 Comment15 years ago -
Food & Agriculture
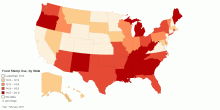
Food Stamp Use, by State
This map shows the percent of the population on food stamps in United States America. More Americans are using food stamps, but the percent of the population en ...4.58 rating | 67,977 views | 8 Comments15 years ago -
Food & Agriculture
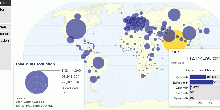
Global Nutrition Consumption and BMI
This map shows worldwide nutrition consumption and body mass index data. The dietary energy consumption per person is the amount of food, in kcal per day, for ea ...3.95 rating | 105,328 views | 7 Comments15 years ago -
Food & Agriculture
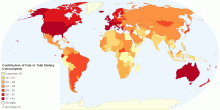
Contribution of Fats in Total Dietary Consumption
This map shows contribution of fats in total dietary energy consumption. World: 26% Developed countries: 34% Developing World: 23% Sub-Saharan Africa: 18% ...4.60 rating | 40,115 views | Discuss this15 years ago -
Food & Agriculture
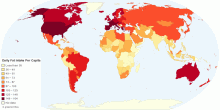
Daily Fat Intake Per Capita
This map shows dietary fat consumption per person. The dietary fat consumption per person is the amount of fat in food, in grams per day, for each individual in ...4.53 rating | 84,904 views | 4 Comments15 years ago -
Food & Agriculture
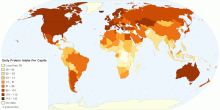
Daily Protein Intake Per Capita
This map shows dietary protein consumption per person. The dietary protein consumption per person is the amount of protein in food, in grams per day, for each in ...4.60 rating | 150,834 views | 1 Comment15 years ago -
Food & Agriculture
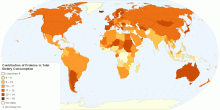
Contribution of Proteins in Total Dietary Consumption
This map shows contribution of proteins in total dietary consumption. World: 11% Developed countries: 12% Developing World: 11% Sub-Saharan Africa: 10% ...4.43 rating | 28,278 views | 1 Comment15 years ago -
Food & Agriculture
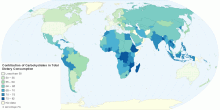
Contribution of Carbohydrates in Total Dietary Consumption
This map shows contribution of carbohydrates in total dietary energy consumption. World: 63% Developed countries: 53% Developing World: 67% Sub-Saharan Afr ...4.26 rating | 363,805 views | Discuss this15 years ago -
Food & Agriculture
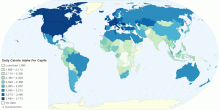
Daily Calorie Intake Per Capita
This map shows dietary energy consumption per person. The dietary energy consumption per person is the amount of food, in kcal per day, for each individual in th ...4.19 rating | 389,353 views | 18 Comments15 years ago -
Food & Agriculture
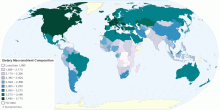
Dietary Macronutrient Composition per capita
This map shows dietary macronutrient composition per person. The dietary energy consumption per person is the amount of food, in kcal per day, for each individua ...4.30 rating | 151,596 views | Discuss this15 years ago -
Food & Agriculture
Global Distribution of Genetically Modified (GM) Crops
This map shows global distribution of Genetically Modified (GM) crops. Current World hectarage of biotech crops: 148.6 million hectares in 2010 World hectara ...4.37 rating | 77,985 views | 2 Comments15 years ago -
Food & Agriculture
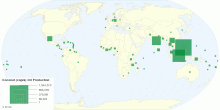
Worldwide Coconut (copra) Oil Production
This map shows worldwide coconut (copra) oil production in tonnes. Current world Coconut oil production: 3,734,208 tonnes What is Copra? Copra is dried sectio ...3.82 rating | 11,533 views | Discuss this15 years ago -
Food & Agriculture
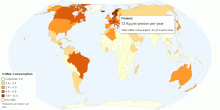
Current Worldwide Annual Coffee Consumption per capita
This map shows Coffee consumption in kilograms, consumed annually by each person in a given country or region. Current World Total Coffee Consumption: 1.3 Kilogr ...4.51 rating | 838,553 views | 26 Comments15 years ago -
Food & Agriculture
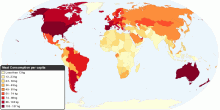
Current Worldwide Annual Meat Consumption per capita
This map shows current worldwide annual Meat Consumption per capita. World average meat consumption: 46.6 kg per person per year4.69 rating | 181,581 views | 25 Comments16 years ago