-
Society
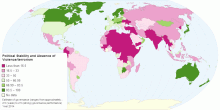
Political Stability and Absence of Violence/terrorism
This map shows "Political Stability and Absence of Violence/Terrorism", a dimension of governances in Worldwide Governance Indicators (WGI) project by ...3.86 rating | 27,775 views | Discuss this10 years ago -
Information and Communication Technology
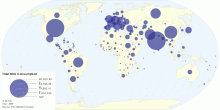
Number of Fixed Telephone Lines by Country Per 100 People
This world map shows Number of Fixed Telephone Lines by Country, per 100 people. Current worldwide number of fixed telephone lines: 17.2 per 100 people (2010) ...3.84 rating | 34,990 views | 1 Comment14 years ago -
Country Info
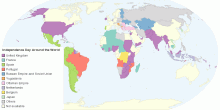
Independence Day Around the World
This map shows Independence Day around the world. An Independence Day is an annual celebration commemorating the anniversary of a nation's assumption of ind ...3.94 rating | 93,106 views | 13 Comments14 years ago -
Country Info
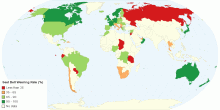
Seat Belt Wearing Rate (%)
This interactive map shows national estimate of the proportion of car occupants (i.e. drivers and passengers) who use seat-belts. A seat belt or seatbelt, somet ...3.70 rating | 20,929 views | 1 Comment14 years ago -
Country Info
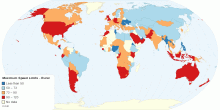
Maximum Speed Limits - Rural
This interactive map shows maximum speed limits in rural environment.3.74 rating | 31,644 views | 13 Comments14 years ago -
Economic
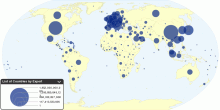
List of Countries by Exports
This map shows list of countries by exports. Exports means goods manufactured domestically that are bought by foreigners and sent to another county. The value re ...3.52 rating | 21,422 views | 2 Comments15 years ago -
Energy
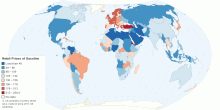
Worldwide Retail Prices of Gasoline (US cents per litre)
This map shows worldwide retail prices of gasoline (in US cents per litre) in more than 183 countries. Gasoline (also known as a petrol) refer to super gasoline ...4.59 rating | 252,614 views | 14 Comments14 years ago -
Food & Agriculture
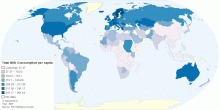
Current Worldwide Total Milk Consumption per capita
This map shows current worldwide total Milk consumption (excluding butter) per capita. World Average Milk Consumption: 108 kg per person per year4.51 rating | 260,673 views | Discuss this14 years ago -
Energy
Current Nuclear Power Reactors in Operation by Type
This chart shows current Nuclear Power Reactors in operation by type. Number of nuclear power reactors in operation: 436 with a total net installed capacity of ...4.78 rating | 16,748 views | Discuss this16 years ago -
Environment
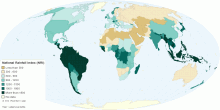
National Rainfall Index (NRI)
This map shows national rainfall index (NRI). Waht is National Rainfall Index (NRI)? A national rainfall index (NRI) is defined as the national average of the ...4.62 rating | 37,235 views | Discuss this14 years ago -
Health
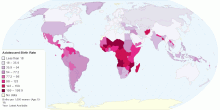
Adolescent Birth Rate
This map shows adolescent birth rate, that measures the annual number of births to women 15 to 19 years of age per 1,000 women in that age group. It represents t ...4.54 rating | 34,196 views | 3 Comments14 years ago -
Food & Agriculture
Current Worldwide Total Milk Consumption
This map shows current worldwide total Milk consumption (excluding butter). World Total Milk Consumption: 558,983,380 tonnes per year4.47 rating | 42,805 views | Discuss this14 years ago -
Food & Agriculture
Current Worldwide Total Milk Production
This map shows current worldwide total Milk production. World Total Milk Production: 703,996,079 tonnes per year Note: Total Milk = Cow milk + Buffalo milk + G ...4.41 rating | 120,269 views | 4 Comments14 years ago -
Social
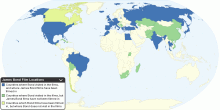
Countries that James Bond Visited in the Films
This map shows list of countries in which films of the James Bond series have been set and filmed. The James Bond film series is a series of motion pictures, bas ...4.43 rating | 36,487 views | 9 Comments15 years ago -
Energy
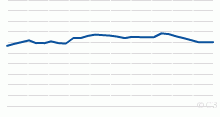
Historical World Reserves-to-production ratio of Na ...
This chart shows the Historical World Reserves-to-production ratio of Natural Gas - 1980 onwards. Current World Reserves-to-production ratio of Natural Gas: 60. ...5.00 rating | 10,067 views | Discuss this16 years ago