-
Country Info
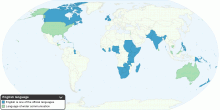
Countries where English is an Official Language
This map shows countries where English is an official language. English is a West Germanic language that arose in England and south-eastern Scotland in the time ...4.03 rating | 140,913 views | 13 Comments16 years ago -
Drugs & Crime
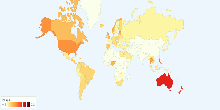
Current Worldwide Annual Prevalence of Amphetamines ...
This chart shows current worldwide annual prevalence of amphetamine-type stimulants (excluding ecstasy) in population aged 15-64. Number of people who used Amphe ...3.74 rating | 15,228 views | Discuss this17 years ago -
Environment
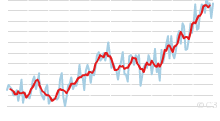
Historical Global Land-Ocean Temperatures, 1880 to Present
The time series shows the combined global land and ocean surface temperature record from 1880 to present, with the base period 1951-1980. How data were collecte ...3.97 rating | 29,125 views | 3 Comments16 years ago -
Environment
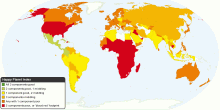
Happy Planet Index (HPI)
This map shows the overall scores from the second global compilation of the Happy Planet Index (HPI). The HPI is an index of human well-being and environmental i ...3.99 rating | 63,424 views | 9 Comments16 years ago -
Population
India's Population Density
This map shows India's population density in 2011 census. India's Population Density:382 persons per sq. km. (2011) India's Population Density: 325 ...4.01 rating | 67,068 views | 5 Comments15 years ago -
Environment
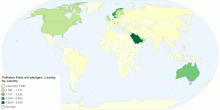
Pakistan flood aid pledged, country by country
Floods have decimated Pakistan: the number of people suffering could exceed the combined total of the 2004 Indian Ocean tsunami, the 2005 Kashmir earthquake and ...3.00 rating | 9,755 views | Discuss this16 years ago -
People
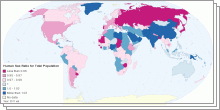
World Sex Ratio 2011
This collection of interactive maps shows Sex Ratio in five age groups - at birth, under 15 years, 15-64 years, 65 years and over, and for the total population. ...4.01 rating | 218,370 views | 3 Comments15 years ago -
Social
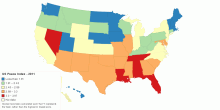
United States Peace Index 2011 - Score
This map shows 2011 United States Peace Index (USPI) Score. The United States Peace Index (USPI) is the first in a series of national peace indices that will bu ...3.67 rating | 15,799 views | 1 Comment15 years ago -
Environment
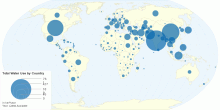
Total Water Use by Country
This map shows total water withdrawal for agricultural, industrial and municipal purposes by country. Water withdrawal is the quantity of water removed from avai ...3.97 rating | 38,333 views | Discuss this15 years ago -
Sports
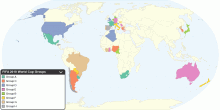
Groups for the FIFA World Cup - 2010
This map shows groups for the 2010 FIFA World cup. The group was based on the October 2009 FIFA World Ranking. Group selection procedure There will be four pots ...3.70 rating | 24,474 views | 1 Comment16 years ago -
Health
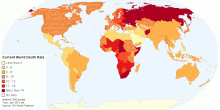
Current World Death Rate
This map shows current annual number of deaths during a year per 1,000 population at midyear; also known as crude death rate. Current World Death Rate: 7.9 deat ...3.93 rating | 45,818 views | 1 Comment14 years ago -
Economic
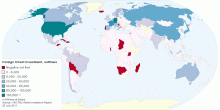
Foreign Direct Investment (FDI), outflows
This interactive map shows outflows of foreign direct investment at the country-level, in million US dollars. Global foreign direct investment outflows: US$1.32 ...3.82 rating | 24,080 views | Discuss this15 years ago -
Economic
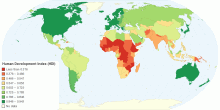
Human Development Index (HDI)
This map shows Human Development Index (HDI) for 169 countries in the World. Update for 2011 What is Human Development Index? The Human Development Index (HDI ...4.00 rating | 202,331 views | 16 Comments14 years ago -
Social
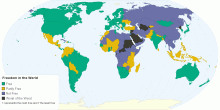
Freedom in the World
This map shows Freedom in the World in 2015. Free: 89 countries Partly Free: 54 countries Not Free: 42 countries Worst of the Worst: 9 countries ...3.93 rating | 177,416 views | Discuss this10 years ago -
Energy
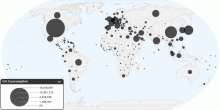
Current Worldwide Oil Consumption
This chart shows current oil consumption in the world. Current Oil Consumption in the World: 84,455,330 barrels per day (bbl/day) 1 barrel = (42 US gallons, 158. ...3.96 rating | 47,702 views | 42 Comments16 years ago