-
Economic
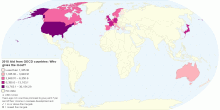
2010 Aid from OECD countries: Who gives the most?
This map shows 2010 Official Development Assistance by OECD member countries. 41 years ago (in 1969) rich countries promised to give 0.7 per cent of their income ...2.60 rating | 6,476 views | Discuss this16 years ago -
Religion
Sikhism Adherents by Country
This chart shows current sikhism followers by Country. Number of Sikhism followers in the world: 0.35% (23,765,218 people).3.93 rating | 25,490 views | Discuss this17 years ago -
Health
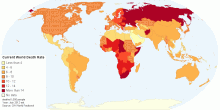
Current World Death Rate
This map shows current annual number of deaths during a year per 1,000 population at midyear; also known as crude death rate. Current World Death Rate: 7.9 deat ...3.89 rating | 48,128 views | 1 Comment14 years ago -
Religion
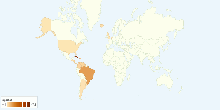
Spiritism Adherents by Country
This chart shows current Spiritism followers by Country. Number of Spiritism followers in the world: 0.2% (13,580,125 people).3.92 rating | 29,443 views | 2 Comments17 years ago -
Energy
Current Worldwide Oil reserves
This chart shows current Oil reserves in the world. Current Oil reserves in the World: 1,248,795,488,139 barrels (bbl) (42 US gallons, 158.9873 litres,or 34.9723 ...3.80 rating | 28,256 views | 10 Comments17 years ago -
Social
Historical Freedom in the World, 1972 to Present
This chart shows historical Freedom in the World - 1972 onwards. What is Freedom in the World? and How is the Freedom of the World calculated? Note: 1982: T ...3.67 rating | 16,705 views | Discuss this17 years ago -
Country Info
Top 10 Longest Rivers
This chart shows top 10 longest river on Earth. The length of a river is very hard to calculate, the source, the identification of the mouth, and the scale of m ...3.96 rating | 60,630 views | 6 Comments16 years ago -
Energy
Current Worldwide Coal Production
This chart shows current Coal Production in the world. Current Coal Production in the World: 6,781,173,808 tonnes3.74 rating | 14,889 views | Discuss this17 years ago -
Society
Voice and Accountability
This map shows "Voice and Accountability", a dimension of governances in Worldwide Governance Indicators (WGI) project by World Bank Group, which refle ...3.71 rating | 27,870 views | Discuss this11 years ago -
Information and Communication Technology
Number of Fixed Telephone Lines by Country Per 100 People
This world map shows Number of Fixed Telephone Lines by Country, per 100 people. Current worldwide number of fixed telephone lines: 17.2 per 100 people (2010) ...3.84 rating | 37,429 views | 1 Comment15 years ago -
Country Info
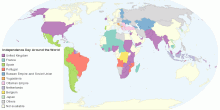
Independence Day Around the World
This map shows Independence Day around the world. An Independence Day is an annual celebration commemorating the anniversary of a nation's assumption of ind ...3.94 rating | 99,359 views | 13 Comments15 years ago -
Economic
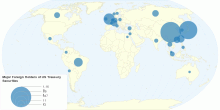
How Much Money Does America Owe Other Countries?
This interactive map shows leading foreign holders of United States Treasury Securities (at end of period - May 2011). Grand total: US $4,514 billions What is ...3.96 rating | 210,841 views | 34 Comments15 years ago -
Food & Agriculture
Global Nutrition Consumption and BMI
This map shows worldwide nutrition consumption and body mass index data. The dietary energy consumption per person is the amount of food, in kcal per day, for ea ...3.95 rating | 105,701 views | 7 Comments16 years ago -
Social
Number of Cinema Admissions per Person by Country, ...
This chart shows number of cinema admissions per person in each country. Number of cinema admissions in the major countries: ~1.45 visits per person3.85 rating | 30,094 views | 4 Comments17 years ago -
Information and Communication Technology
Worldwide Digital Access Index
This map shows Digital Access Index (DAI) around the world. Digital access allows individuals and communities to access information on changing weather patterns ...3.92 rating | 66,860 views | 5 Comments17 years ago