-
Energy
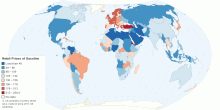
Worldwide Retail Prices of Gasoline (US cents per litre)
This map shows worldwide retail prices of gasoline (in US cents per litre) in more than 183 countries. Gasoline (also known as a petrol) refer to super gasoline ...4.59 rating | 252,427 views | 14 Comments14 years ago -
Economic
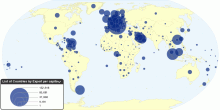
List of Countries by Exports per capita
This map shows list of countries by exports per capita. Exports means goods manufactured domestically that are bought by foreigners and sent to another county. T ...2.96 rating | 25,783 views | Discuss this15 years ago -
Social
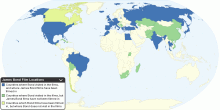
Countries that James Bond Visited in the Films
This map shows list of countries in which films of the James Bond series have been set and filmed. The James Bond film series is a series of motion pictures, bas ...4.43 rating | 36,349 views | 9 Comments15 years ago -
Country Info
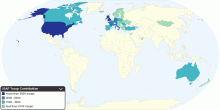
Countries Currently Contributing Troops to ISAF
This map shows countries currently contributing troops to International Security Assistance Force (ISAF). ISAF is a NATO-led security mission in Afghanistan esta ...4.29 rating | 30,040 views | 2 Comments15 years ago -
Drugs & Crime
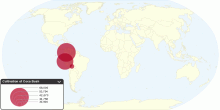
Current Worldwide Illicit Cultivation of Coca Bush ...
This chart shows current worldwide illicit cultivation of coca bush and production of cocaine. Total area under coca bush cultivation: 158,800 hectares (h ...3.22 rating | 21,535 views | Discuss this15 years ago -
Energy
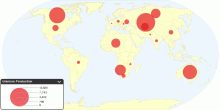
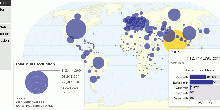
Current Worldwide Uranium Production
This map shows current worldwide uranium production from mines. A prominent use of uranium from mining is as fuel for nuclear power plants. The worldwide product ...4.32 rating | 26,319 views | 1 Comment15 years ago -
Health
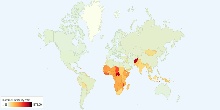
Current Worldwide Maternal Mortality Rate
This chart shows current worldwide Maternal Mortality Rate per 100,000 live births. Current World Maternal mortality rates (2008): 251 per 100,000 live births ...4.33 rating | 42,483 views | Discuss this15 years ago -
Energy
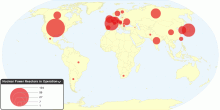
Current Nuclear Power Reactors in Operation by Type
This chart shows current Nuclear Power Reactors in operation by type. Number of nuclear power reactors in operation: 436 with a total net installed capacity of ...4.78 rating | 16,646 views | Discuss this16 years ago -
Energy
Current Nuclear Power Reactors in Operation by Country
This chart shows current Nuclear Power Reactors in operation worldwide. Number of nuclear power reactors in operation: 436 with a total net installed capacity of ...5.00 rating | 13,714 views | Discuss this16 years ago -
Energy
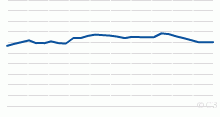
Historical World Reserves-to-production ratio of Na ...
This chart shows the Historical World Reserves-to-production ratio of Natural Gas - 1980 onwards. Current World Reserves-to-production ratio of Natural Gas: 60. ...5.00 rating | 9,951 views | Discuss this16 years ago -
Food & Agriculture
Global Milk Production and Consumption
This map shows current worldwide Milk production and consumption. World Total Milk Production: 703,996,079 tonnes per year World Total Milk Consumption (excludin ...4.39 rating | 124,237 views | 8 Comments14 years ago -
Drugs & Crime
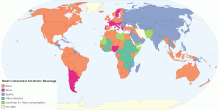
Most Consumed Alcoholic Beverage by Country
This map shows worldwide distribution of most consumed alcoholic (beer, wine, spirits or other alcoholic) beverages, in litres of pure alcohol. Key findings for ...4.53 rating | 758,013 views | 3 Comments14 years ago -
Environment
Current Worldwide CO₂ Emissions from the Consumpt ...
This map shows current and historical worldwide carbon dioxide(CO₂) emissions from the consumption of energy. Data includes emissions due to the consumption of ...4.53 rating | 40,533 views | Discuss this14 years ago -
Health
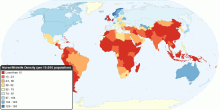
Global Distribution of Nurse/Midwife per 10,000 population
This map shows the density of nursing and midwifery personnel as the number of nurses/midwives per 10,000 population, in 2000 - 2009. World Nurses/Midwives ...4.33 rating | 30,160 views | Discuss this15 years ago -
Economic
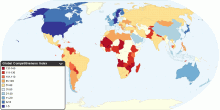
Global Competitiveness Index
This map shows 2010-2011 Global Competitiveness Index (GCI) in 139 major and emerging economies from all of the world's regions. The GCI, a highly comprehensive ...4.54 rating | 37,702 views | 3 Comments15 years ago