-
Energy
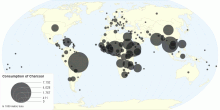
Final Consumption of Charcoal by Country
This chart shows the final consumption of charcoal by country. Charcoal is a light, black residue, consisting of carbon and any remaining ash, obtained by remov ...4.33 rating | 9,920 views | Discuss this10 years ago -
Energy
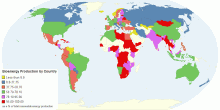
Bioenergy Production by Country
This chart shows the Bioenergy production by country. Bioenergy is renewable energy made available from materials derived from biological sources. Biomass is an ...4.00 rating | 5,537 views | Discuss this10 years ago -
Energy
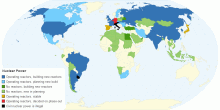
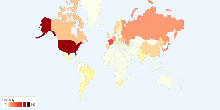
Nuclear Power by Country
This map shows the Nuclear Power Reactors by each country. A nuclear reactor, formerly known as atomic pile, is a device used to initiate and control a sustaine ...4.33 rating | 8,895 views | Discuss this10 years ago -
Energy
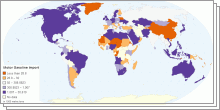
Motor Gasoline Import & Export data by country
This chart shows Motor Gasoline Import & Export data by country. Gasoline also known as petrol outside of North America, is a transparent, petroleum-derived ...4.33 rating | 5,880 views | Discuss this10 years ago -
Energy
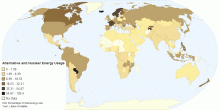
Alternative and Nuclear Energy (Percentage of Total ...
This map shows clean energy, expressed as a percentage of total energy use. Clean energy is noncarbohydrate energy that does not produce carbon dioxide whe ...4.02 rating | 45,695 views | 7 Comments14 years ago -
Energy
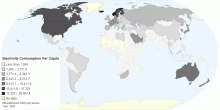
Electricity Consumption Per Capita
Electricity consumption per capita measures the average kilowatt-hours (kWh) of electrical power generated per person in a particular country or region. Note: E ...4.20 rating | 51,255 views | Discuss this14 years ago -
Energy
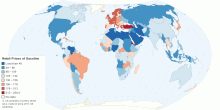
Worldwide Retail Prices of Gasoline (US cents per litre)
This map shows worldwide retail prices of gasoline (in US cents per litre) in more than 183 countries. Gasoline (also known as a petrol) refer to super gasoline ...4.59 rating | 253,384 views | 14 Comments15 years ago -
Energy
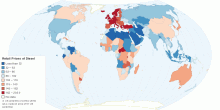
Worldwide Retail Prices of Diesel (US cents per litre)
This map shows worldwide retail prices of petroleum diesel (in US cents per litre) in more than 185 countries. Petroleum diesel, also called petrodiesel, or foss ...4.64 rating | 444,389 views | 10 Comments15 years ago -
Energy
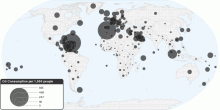
Current Worldwide Oil Consumption per 1000 people
This chart shows current oil consumption (per capita) in the world. Current Oil Consumption in the World: 31.1 barrels per day (bbl/day) per 1,000 people 1 b ...3.48 rating | 28,542 views | Discuss this16 years ago -
Energy
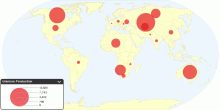
Current Worldwide Uranium Production
This map shows current worldwide uranium production from mines. A prominent use of uranium from mining is as fuel for nuclear power plants. The worldwide product ...4.32 rating | 26,974 views | 1 Comment16 years ago -
Energy
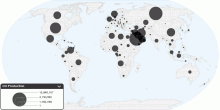
Current Worldwide Oil Production
This chart shows current oil production in the world. Current Oil Production in the World: 81,820,404.59 barrels per day (bbl/day) 1 barrel = (42 US gallons, 158 ...4.04 rating | 65,131 views | 13 Comments16 years ago -
Energy
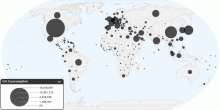
Current Worldwide Oil Consumption
This chart shows current oil consumption in the world. Current Oil Consumption in the World: 84,455,330 barrels per day (bbl/day) 1 barrel = (42 US gallons, 158. ...3.96 rating | 47,101 views | 42 Comments16 years ago -
Energy
Current Nuclear Electricity Generation by Country
This chart shows current Nuclear Electricity Generation worldwide. Current Nuclear Electricity Generation: 2601 billion kWh from 436 nuclear power reactors Not ...4.60 rating | 16,676 views | 1 Comment16 years ago -
Energy
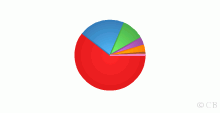
Current Nuclear Power Reactors in Operation by Type
This chart shows current Nuclear Power Reactors in operation by type. Number of nuclear power reactors in operation: 436 with a total net installed capacity of ...4.78 rating | 17,105 views | Discuss this16 years ago -
Energy
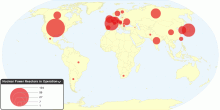
Current Nuclear Power Reactors in Operation by Country
This chart shows current Nuclear Power Reactors in operation worldwide. Number of nuclear power reactors in operation: 436 with a total net installed capacity of ...5.00 rating | 14,260 views | Discuss this16 years ago
